(b) Wave In Progress
Well, it seems we have seen that strong reversal we were expecting and it also was accompanied by news. So, this is rather typical and well in line with our expectations.
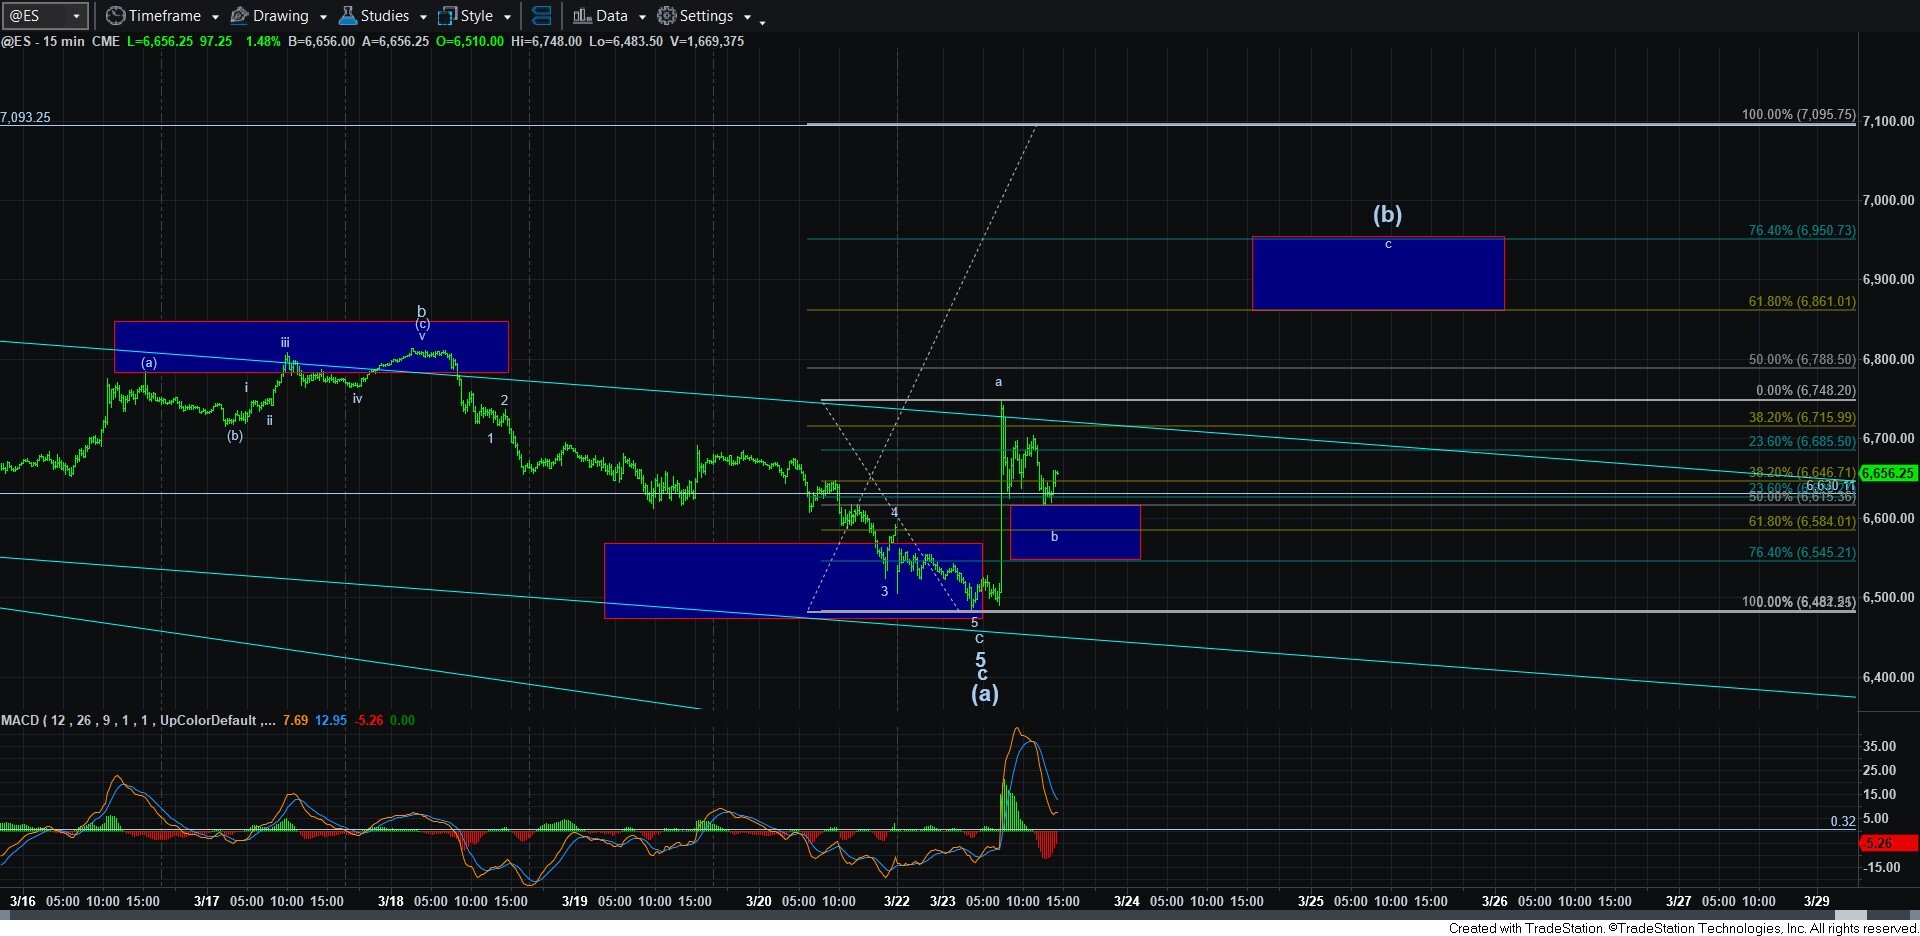
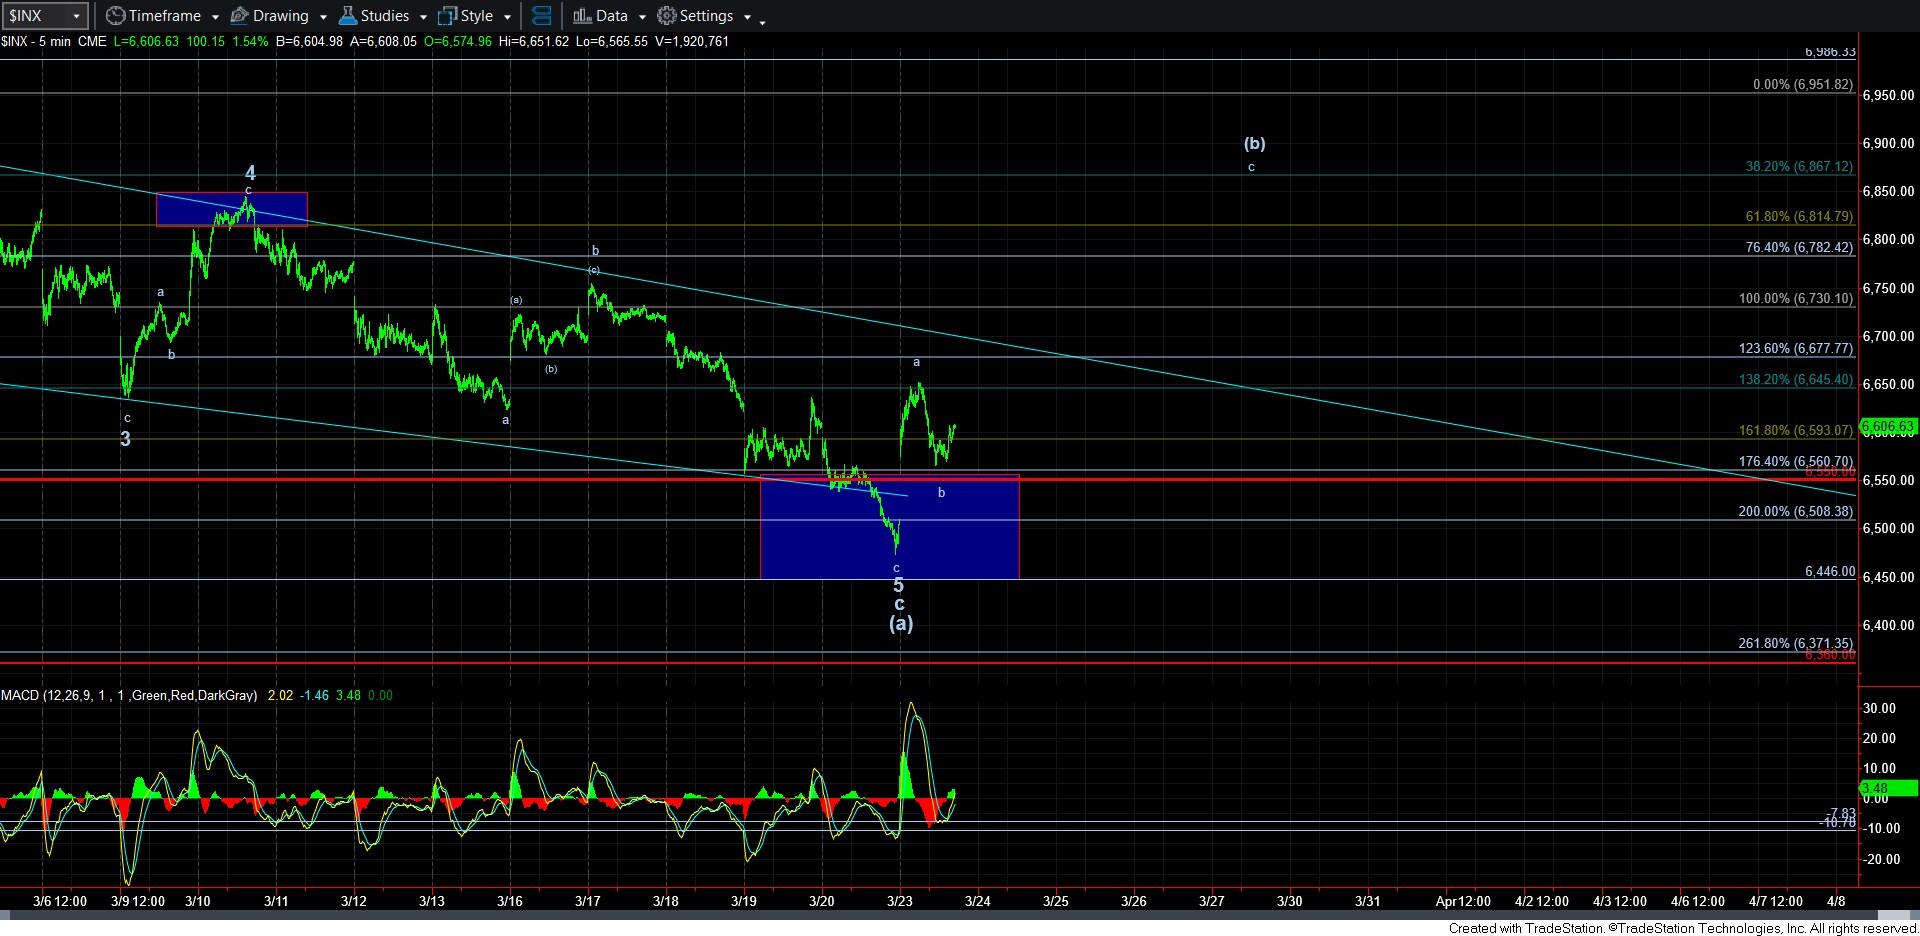
Thus far, the rally seems to be corrective. Moreover, the a-wave within this (b) wave rally spiked just beyond the standard target for an a-wave in a corrective rally, which is the .382 retracement of the (a) wave decline. And, as I noted early in the day that the most likely expectation would be for the market to spend the rest of the day in a corrective b-wave pullback, things seem to be going as planned thus far. And, as you can see from the attached ES chart, we are holding the top of the support box for now.
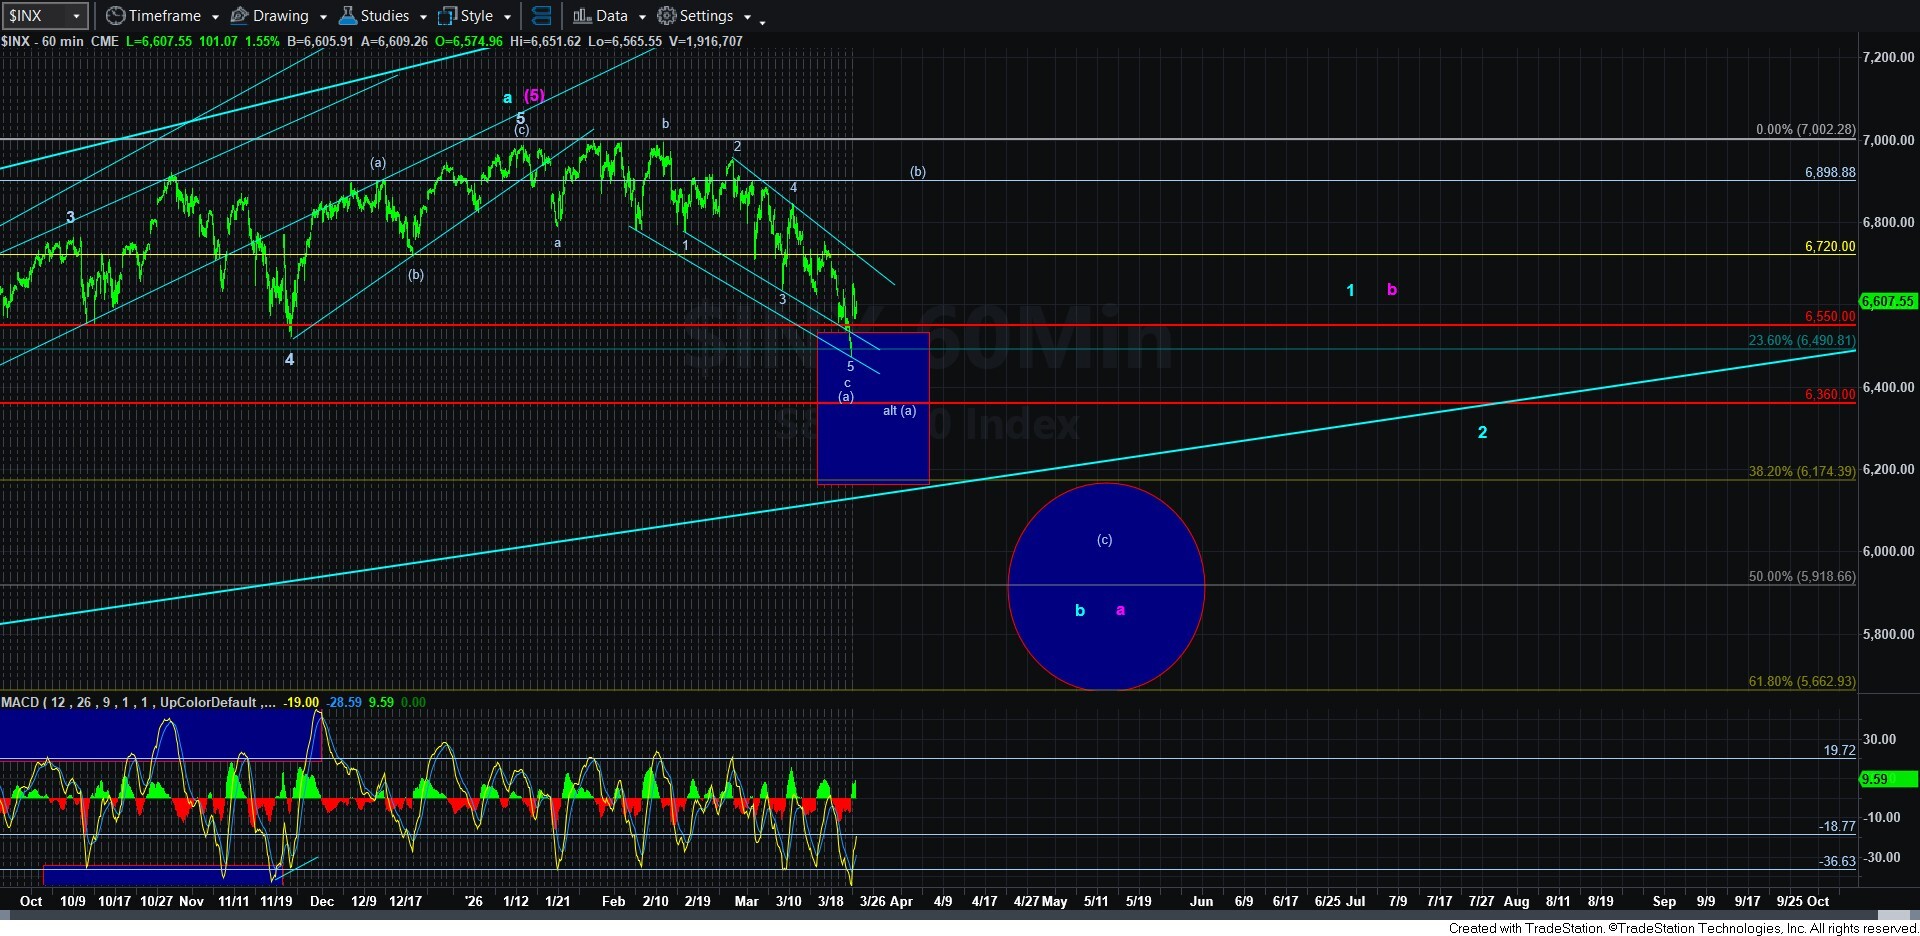
Since the standard expected target for a reversal of a completed diagonal is to return to the general region from which it began, my assumption is that we can rally up to the .764 retracement of the (a) wave decline. And, as you can see on the 13-minute ES chart, that is the top of the target box, with the lower end being the standard expectation for a (b) wave in the .618 retracement region of the (a) wave. So, overall, that target box seems like a reasonable expectation for this (b) wave rally.
Therefore, for now, my expectation in the coming days is that we will return to the 6860-6950ES region.
Alternatively, if we break down below the morning low, then it means this (a) wave has not yet completed, and any further decline would simply extend this (a) wave, with the potential we can still see the ideal target for the (a) wave, being the .382 retracement of the rally off the April 20205 low. But, for now, this is just our alternative. As long as we remain over the support box noted on the 13-minute ES chart, I am looking up towards the (b) wave target box.
I want to add one more issue. I know I repeat this often, but I don’t think it can be repeated enough. Since we are likely in a (b) wave rally, I need to remind you again that, although I have presented a proposed path for this (b) wave, we know that (b) waves are quite variable in nature, and can take many twists and turns that are not always foreseeable. So, while you see a very simple path on the my chart, this could easily take further twists and turns. For example, the next rally may only achieve the .500 retracement region and then only be a larger a-wave within this (b) wave. And, we can also see many other moves which are not being presented on the chart at this time. But, ultimately, the main focus should be that as long as we hold the blue support box on the 13-minute ES chart, we should look higher for this (b) wave bounce. If we break that support box, then it opens the door to the (a) wave not having completed yet.