Yes, I Have Some ‘Concern’
As you know, we have been tracking a very overlapping structure which I initially viewed as a smaller leading diagonal which should have completed no later that this morning. It had an ideal target of 3921SPX, which is the 1.764 extension of the potential waves [i][ii] within that structure, which is the ideal target to complete a diagonal.
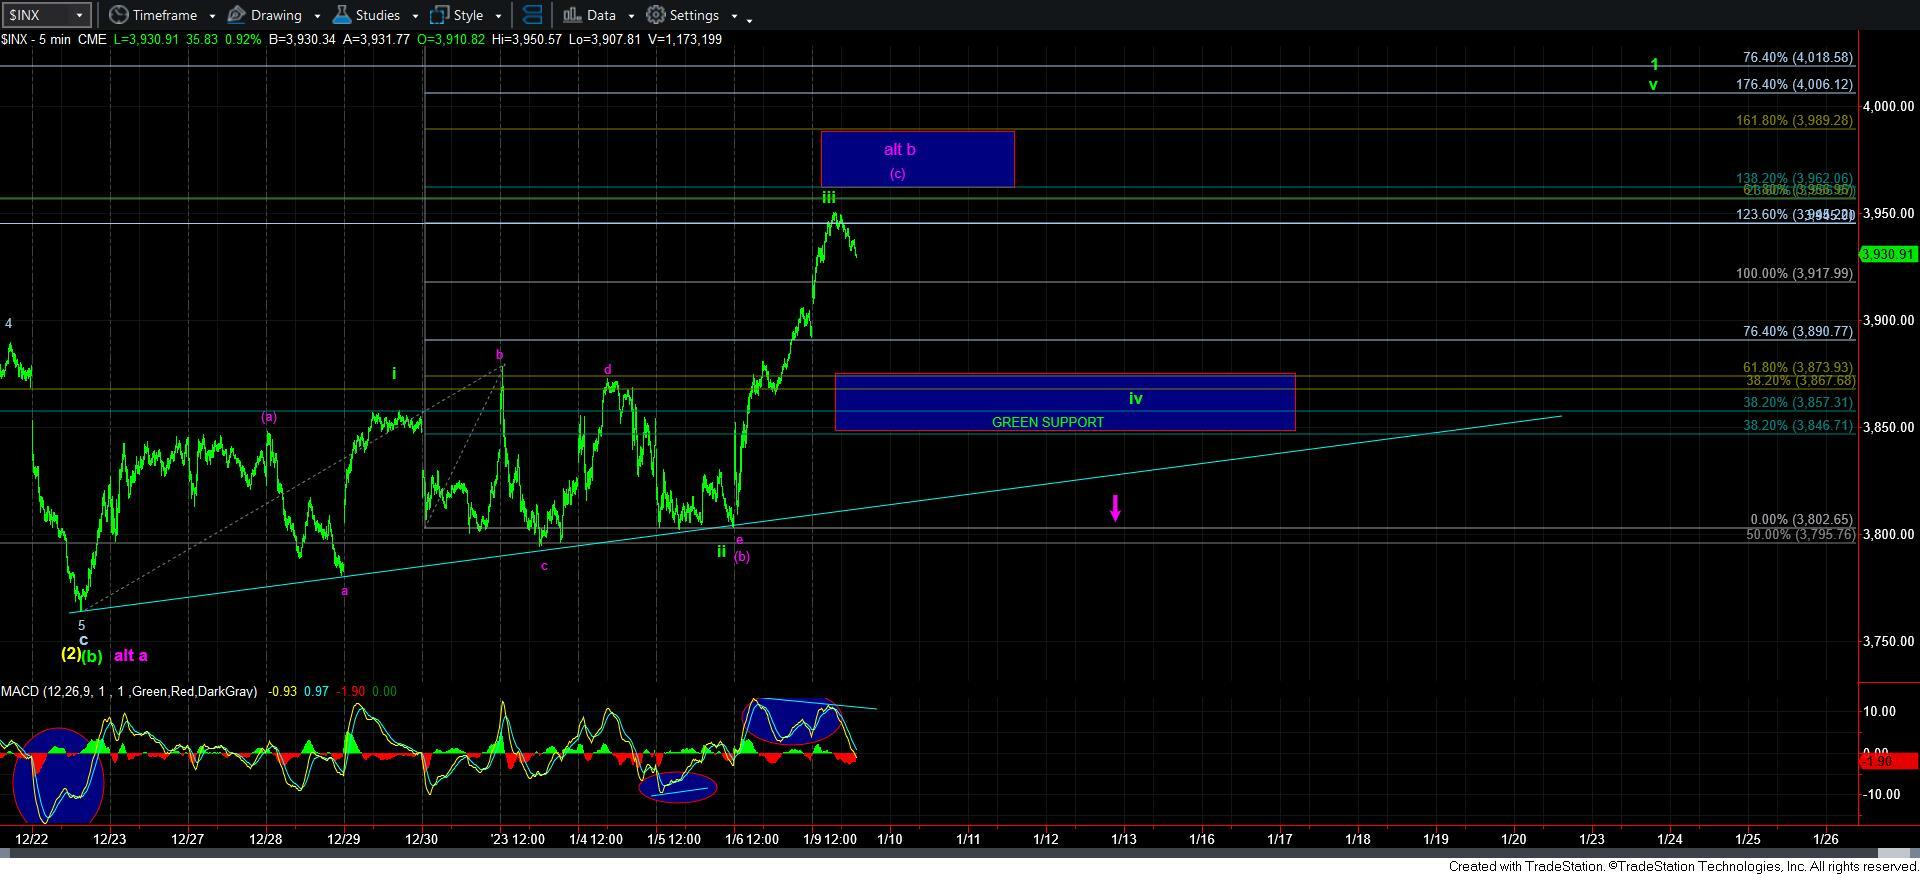
However, we have clearly exceeded that region. And, this certainly placed that count into question, so much so that I am adopting a view of a larger degree leading diagonal, as I outlined earlier today. You can see that structure on the 5-minute SPX chart now.
As an aside, I often highlight how price action provides clues to us in a much more objective manner than does news or economic reports. When the market begins to act out of the norm for the pattern we are tracking, it often is giving us clues that something else is playing out well before that can harm our trading/investing account. This could be one of those instances. But, I digress.
As I warn often, I do not trust leading diagonals, as they take shape too much like a corrective structures. And, this clearly can now be a corrective structure.
I have now added the corrective structure on the 5-minute chart, so you can see why it is a concern. The structure would be an [a][b][c] structure for a b-wave rally in purple, with the [b] wave of the b-wave taking shape as a triangle.
The other issue is that we are approaching the .618 retracement of the decline from the 4100SPX region, which is in the 3970SPX region.
So, as you can see, we now have something to be concerned about. For if we top out in direct fashion in the 3960-3990SPX resistance region, and then begin a CLEAR 5-wave decline, then I will have to assume we are starting a purple c-wave down to the 3600SPX region for a much larger a-b-c pullback off the 4100SPX region.
However, if the market can provide us with a corrective wave iv pullback towards the green support box, and then rally back up to the 3990+ region, then we would have a reasonably complete 5-wave leading diagonal structure. Yet, that does not mean I would wholeheartedly trust it just yet. I would still need a wave 2 pullback, followed by a CLEAR 5-wave rally taking out the high of wave 1 to suggest we have begun the rally to 4300+. Moreover, depending upon the size of the waves 1-2 structure, we may not see much of an extension beyond 4300SPX, since the wave 1 would not be projecting a bit smaller than before. Much will clearly depend on the size of the 3rd wave rally thereafter to glean a better understanding as to where that rally may top.
So, for now, I simply wanted to outline that risks have risen a bit more than I had wanted to see at this juncture. Should the market provide us with an impulsive decline below the green support zone on the 5-minute SPX chart, then I will have to begin looking down to the 3600SPX region next for a larger [b] wave structure.
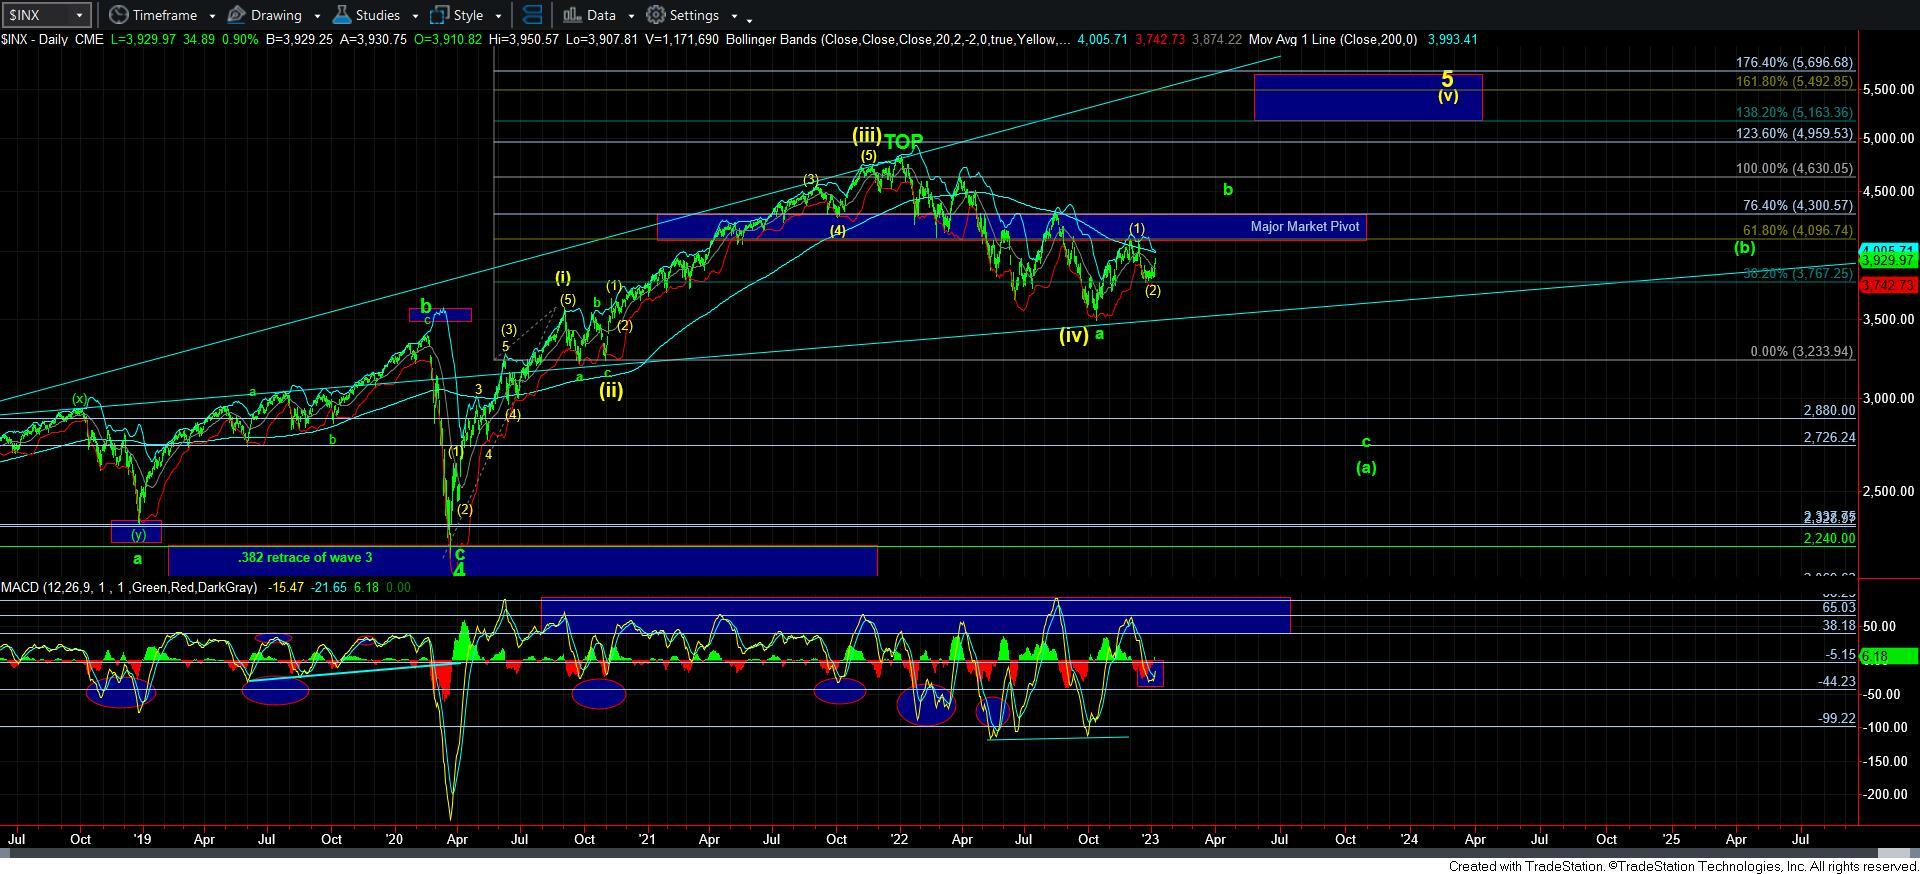
Lastly, I want to address the daily MACD, which has now gone positive. That is a good sign. However, normally we want to see it hold for three days before we can consider it an indication that the [c] wave rally has begun.
This now leaves us with two main focuses for the next week or so. We want to see waves iv-v complete wave 1 towards the 4000SPX region. And, we want to see the daily MACD hold its positive movement. Both of those combined will make it much more likely that we have indeed begun the next rally to 4300+. And, until such time, I am going to be a bit more cautious. When dealing with these structures over the last year, it has clearly forced me to primarily focus on risk management, and the current smaller degree structure is bringing that to the forefront once again. In fact, I am even considering selling the initial position I bought lower and letting the market settle out over the coming week. I would suggest you take stock regarding your own risk tolerance again. You can always choose to put it back into play on a wave 2 retracement.