Yes, I Am ‘Hoping’
I often ponder of the wise words of Paul Tudor Jones, of which I would like to remind you this afternoon:
"I attribute a lot of my success to Elliot Wave Theory. It allows one to create incredibly favorable risk reward opportunities"
There are times when we track Elliott Wave counts that the market is simply quite messy and there is no good position to take. However, there are many times that the market is developing a structure which will provide us with an “incredibly favorable risk reward opportunity.” We are now in that latter scenario.
If you have been following our work for the last several weeks, you would know that we have been patiently awaiting the market to decline off a high in order to provide us indications as to whether the decline will take shape as an impulsive structure (green count) or as a corrective structure (yellow count). And, as we also know, the green count will be pointing us below the October 2022 low over the coming year or so, whereas the yellow count will be pointing us next to the 4800SPX region.
So, as we have been tracking the current decline, to this point, the market has provided us with what is best counted as a leading diagonal for green wave i down. And, it has struck the bare minimum of targets we would expect for a diagonal to complete, and that is the 1.618 extension of waves [i[ and [ii] (whereas the more ideal target is the 1.764 extension, of which we have thus far fallen short).
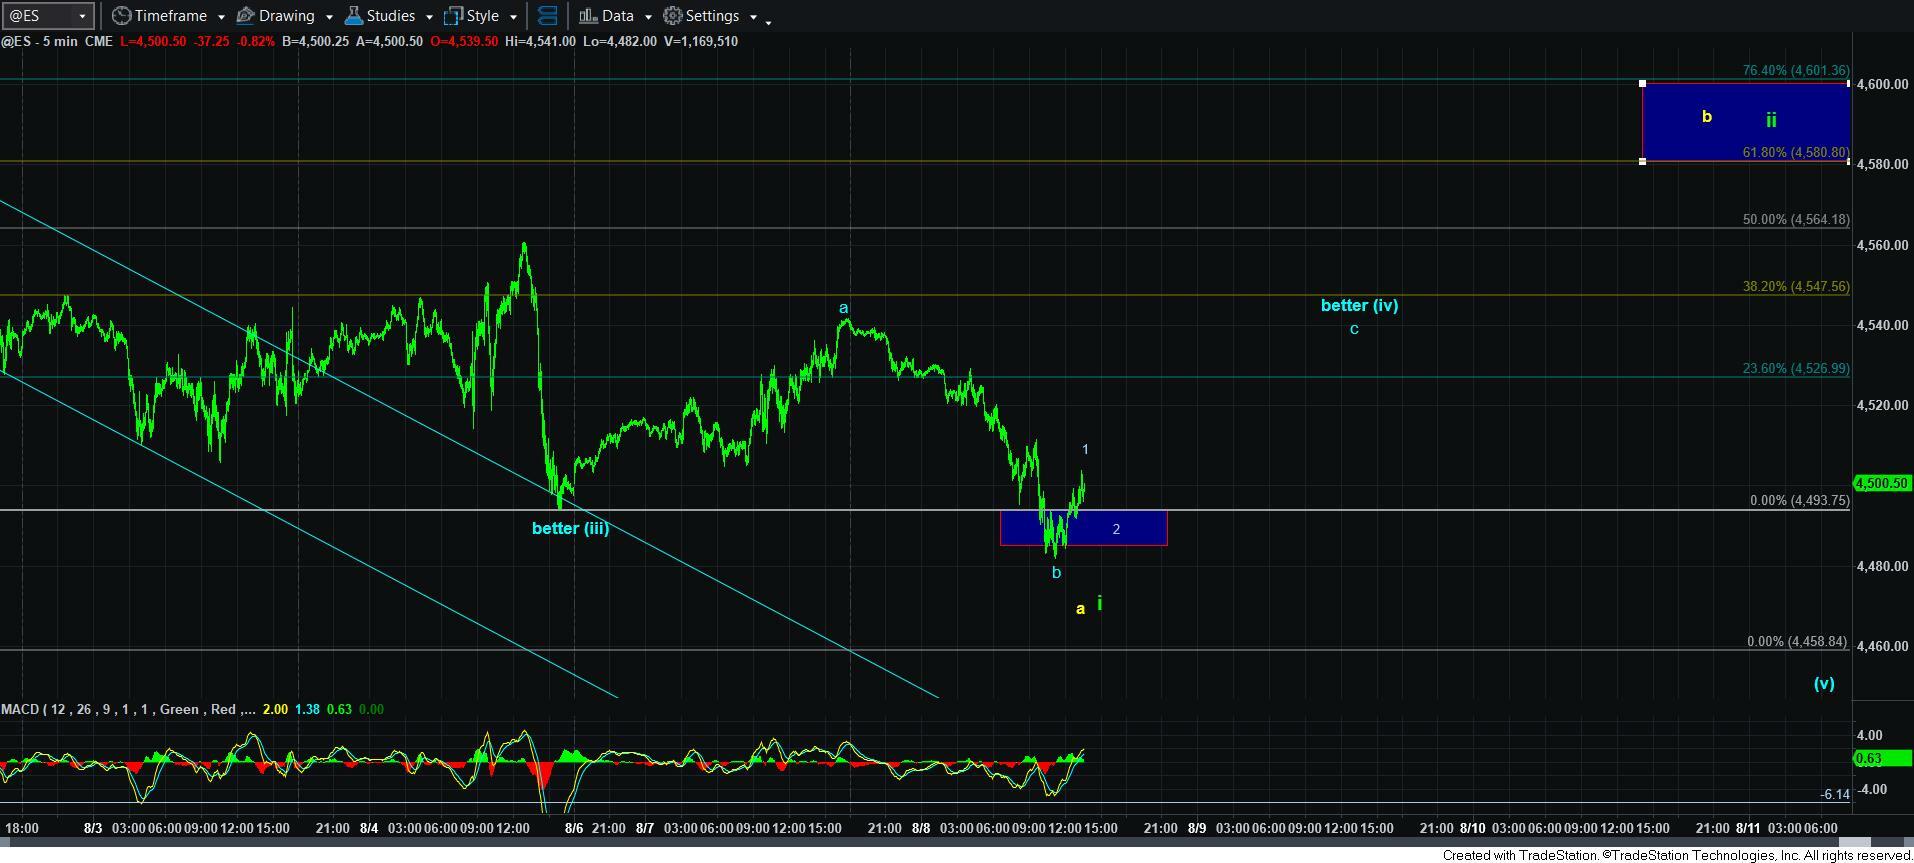
But, since the market did bottom at the 1.618 extension of waves [i] and [ii], it has left the door open that the “better” 5-wave decline structure is still ongoing. And, that is for which I have been ‘hoping.’
As you can see, the “better [iii]” bottomed shy of the 1.618 extension ideal target for wave [iii]. We then rallied right up to the resistance we outlined over the weekend, and, today we turned down from that resistance to the 1.618 extension. What I have seen quite a number of times in my experience is that when the wave [iii] fails to reach its ideal target, we often see the b-wave of the ensuing wave [iv] strike that target, and provide us with an expanded b-wave in the wave [iv] correction. I was outlining this potential yesterday in the trading room for those who took the time to read it.
Now, if this is the appropriate wave count, then it means that today’s low should hold, and provide us with c-wave rally to the 4515SPX resistance region to complete a wave [iv] expanded flat. And, the reason I highlighted this potential yesterday was because the rally to our resistance yesterday seemed relatively too small to be all of wave [iv], as compared to the 4th wave in wave [iii] and compared to wave [ii]. So, I simply surmised that the rally was only an a-wave in wave [iv], which left the potential for an expanded flat, as outlined above, with the potential for a c-wave rally taking us right back up to resistance again. And, yes, this is my ‘hope,’ as long as we hold today’s low
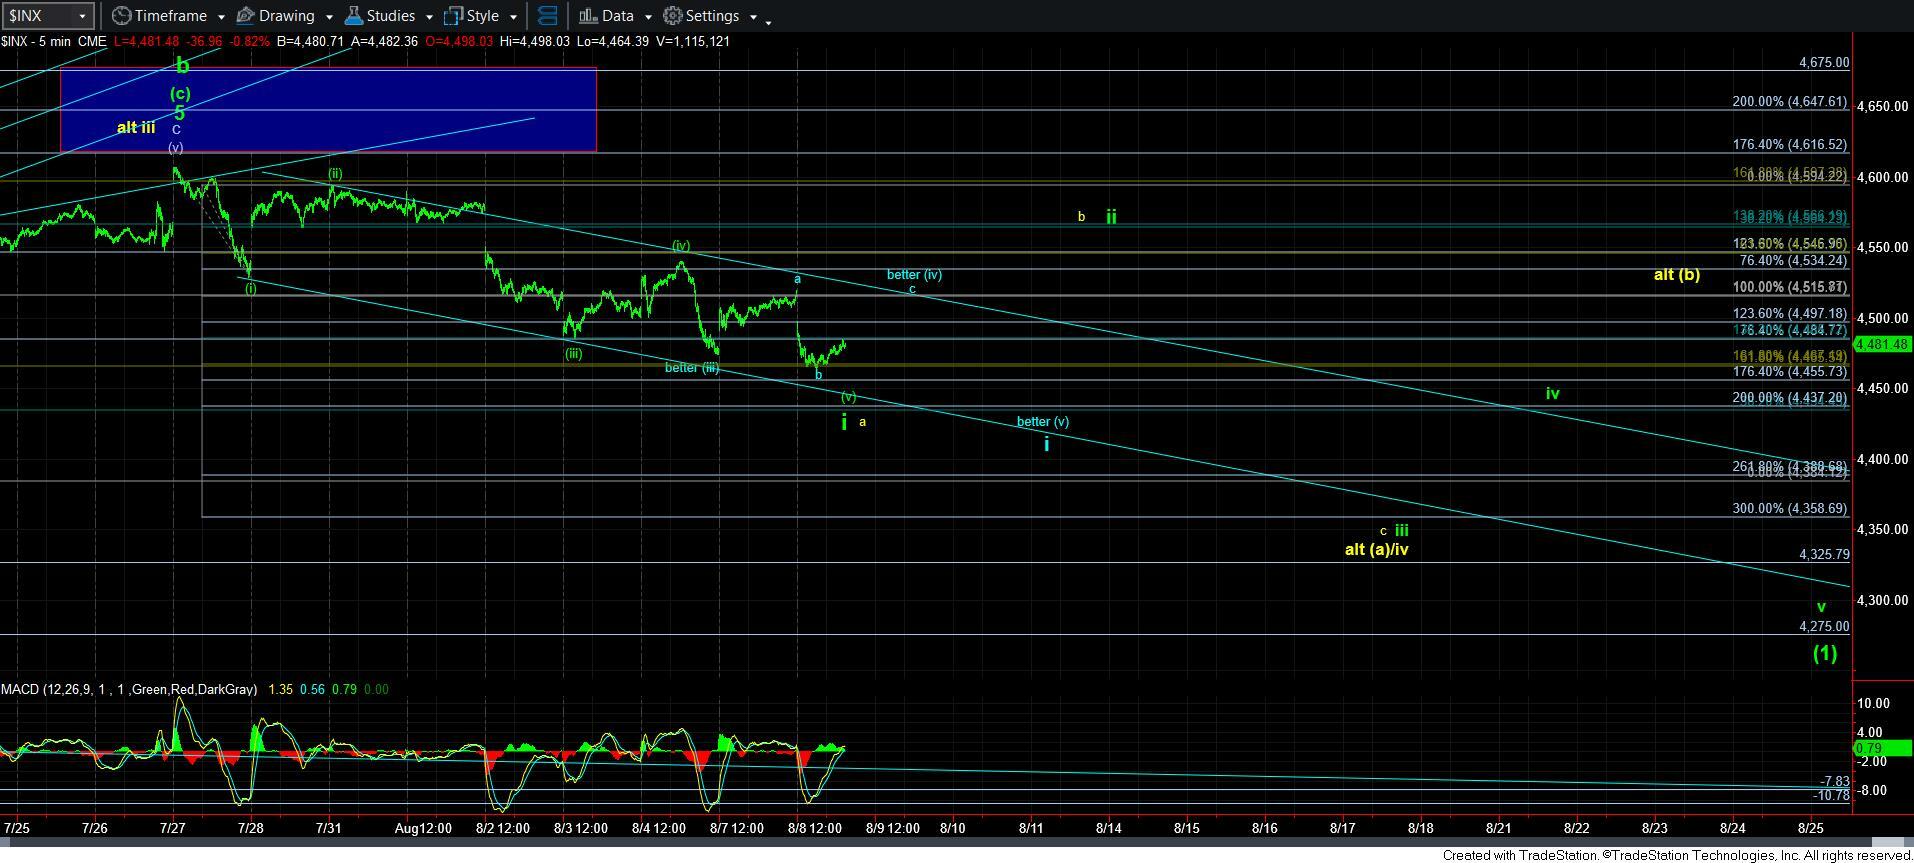
At this time, I cannot trade this wave structure confidently because it is still questionable and incomplete. But, over the coming days, I am expecting the market to either complete the “better” 5-wave decline structure in wave i down, or we will break out through the 4520SPX region and suggest we are in wave ii/b. Should that occur, then the only potential 5-wave decline structure we would have in place is the leading diagonal, which I find too unreliable to trade confidently. So, we would need to see the next decline and bounce take shape in order to be able to confirm a major top is in place or not. And, this is what I outlined in the weekend update.
So, in summary, as long as today’s low holds, I am looking up to the 4515SPX region. And, should we turn down towards the 4437-4455SPX region and complete a 5th wave in the “better” blue count, then we have a much more solid 5-wave decline structure off the recent high, and a higher probability b-wave top in place. This will allow us to short the next wave ii corrective bounce with much greater confident.
Alternatively, if we do not turn down from 4515SPX, and instead continue to rally to the blue box overhead on the 5-minute ES chart, that too can be a shorting opportunity. We will not have a confirmed top in place until the market is able to complete a larger degree 5-wave decline for wave [1], as outlined on the 5-minute SPX chart.
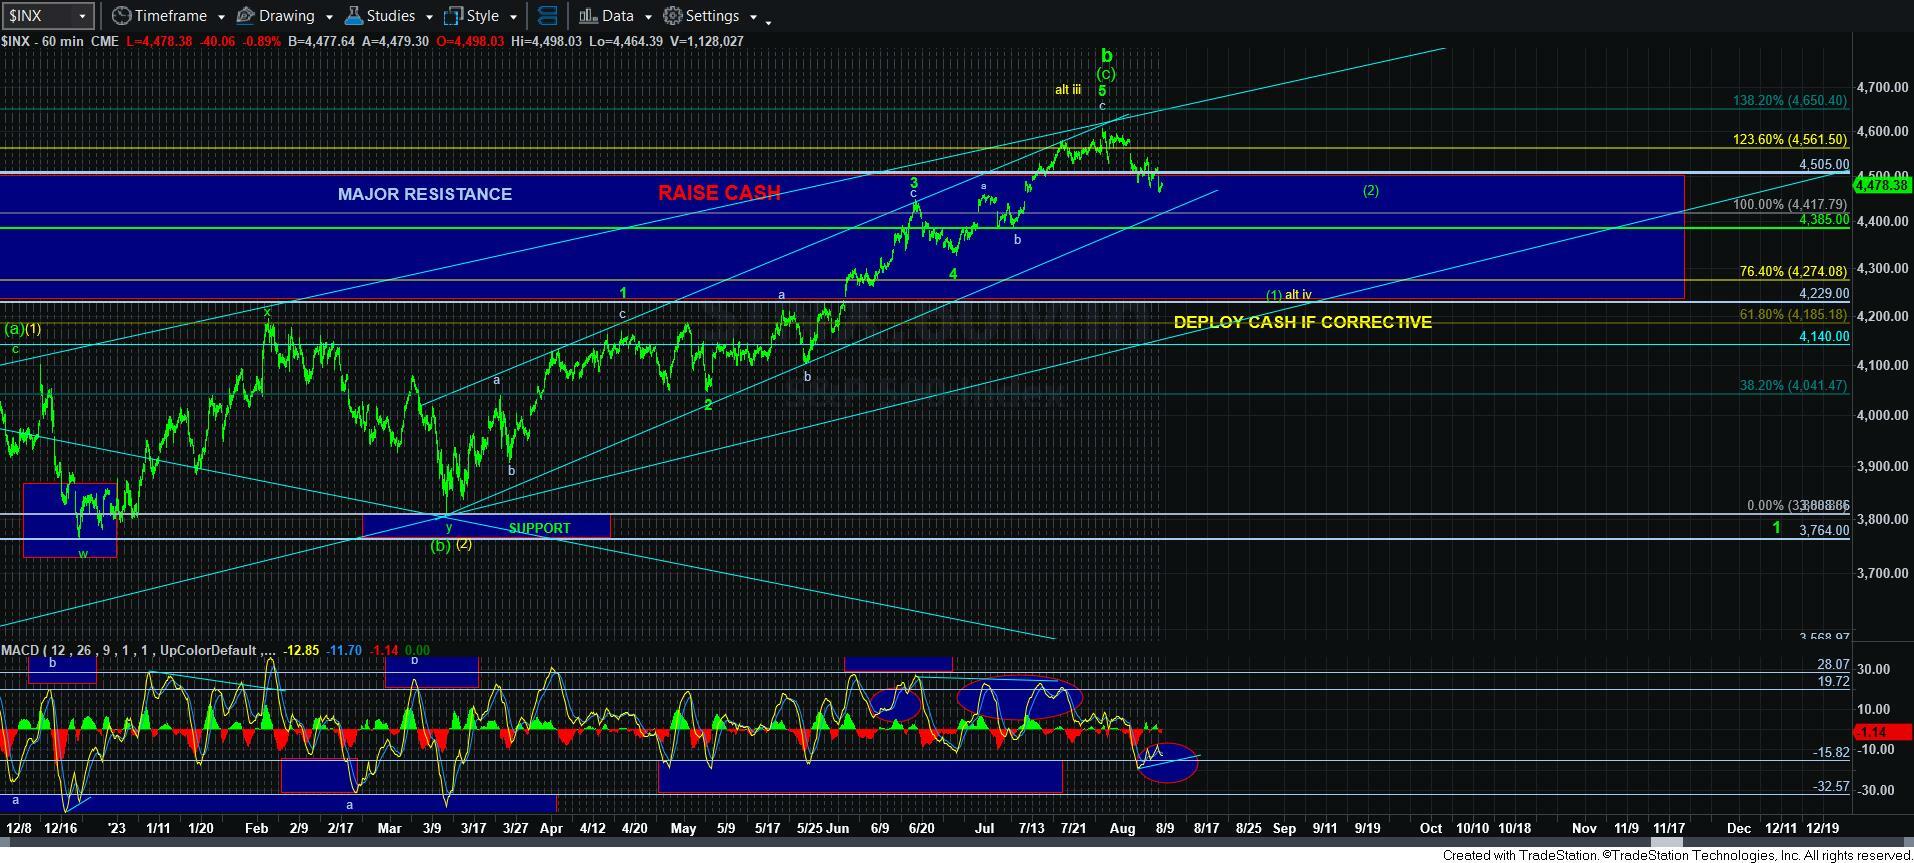
The main point I am trying to make in my latest updates is that the market is trying to decide between two paths. And, we are tracking the micro structures so that we can glean, from a high probability perspective, which of these two paths the market is going to take for the rest of the 2023, and potentially well beyond. So, either we be shorting the market if the “better” blue count takes shape for the foreseeable future, or we will likely see another decline towards the 4270-4350SPX region for a potential long trade in the yellow count, as I outlined in the weekend update.
Lastly, if the market does break down below today’s low, then that makes the “better” blue count much less likely and keeps me in the a/i wave count as long as we hold the 4437-4455SPX support below. And, my expectation is for that to hold based upon the 60-minute MACD hitting support and trying to set up a positive divergent bottom.