Yellow It Is - Market Analysis for May 12th, 2022
Wherever I look, I see market extremes, some of which actually exceed those seen at the lows of March 2020. Yes, we are talking extremes. But, that does not mean we have certainly bottomed. Yet, it does support my perspective which I still retain that we will see new all-time highs when this is done.
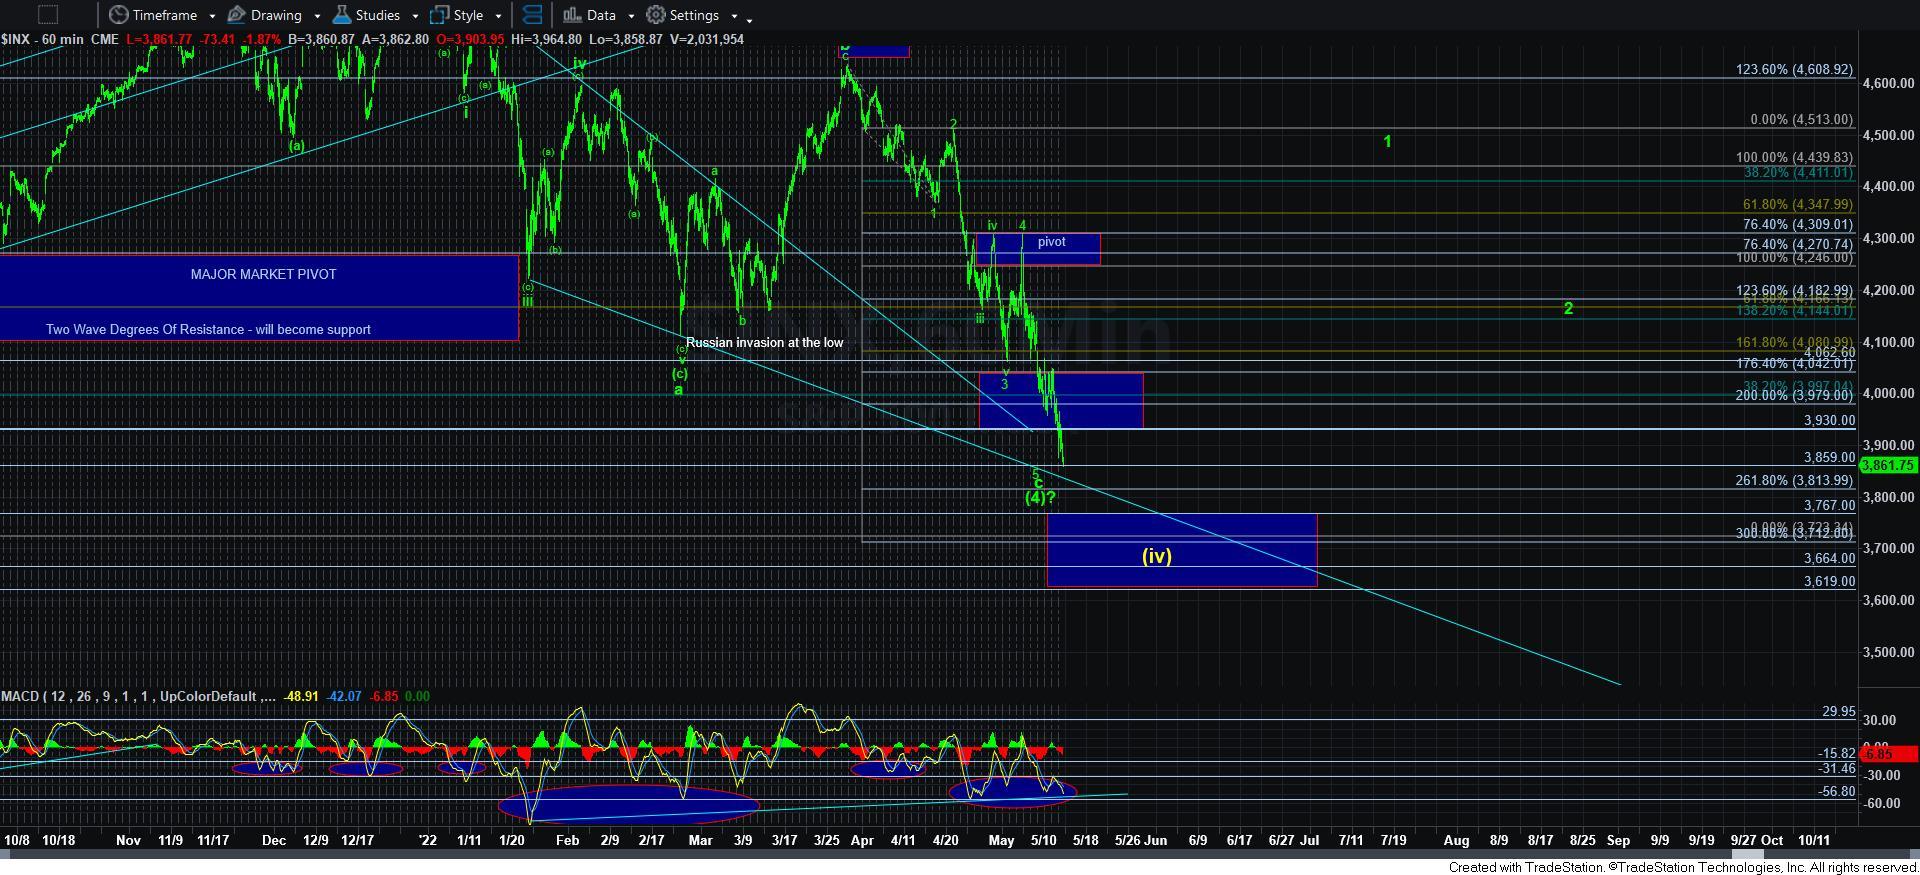
The question with which I had been grappling all this time is whether the market will see one more rally to the 5500 region or if we will get a second (iv)(v) to take us to 6000 in the coming years. At this point in time, due to the depth of this pullback, I have begun to lean towards only one more rally.
In truth, I believe this is somewhat of an academic point, as my plan as outlined to all of you before this even began was to go to cash after the completion of the next major rally. But, based upon the depth of this pullback, I am now thinking that the next rally may even complete all of the bull market off the March 2020 low in the 5500SPX region.
Now, if you look at the 60-minute chart you will see that I still have the wave [4] in green on the chart. I am going to leave it there for now, as an alternative I will keep in mind. But, from all perspectives, I think it is best to view this pullback as wave [iv] despite my feelings about the bigger structure.
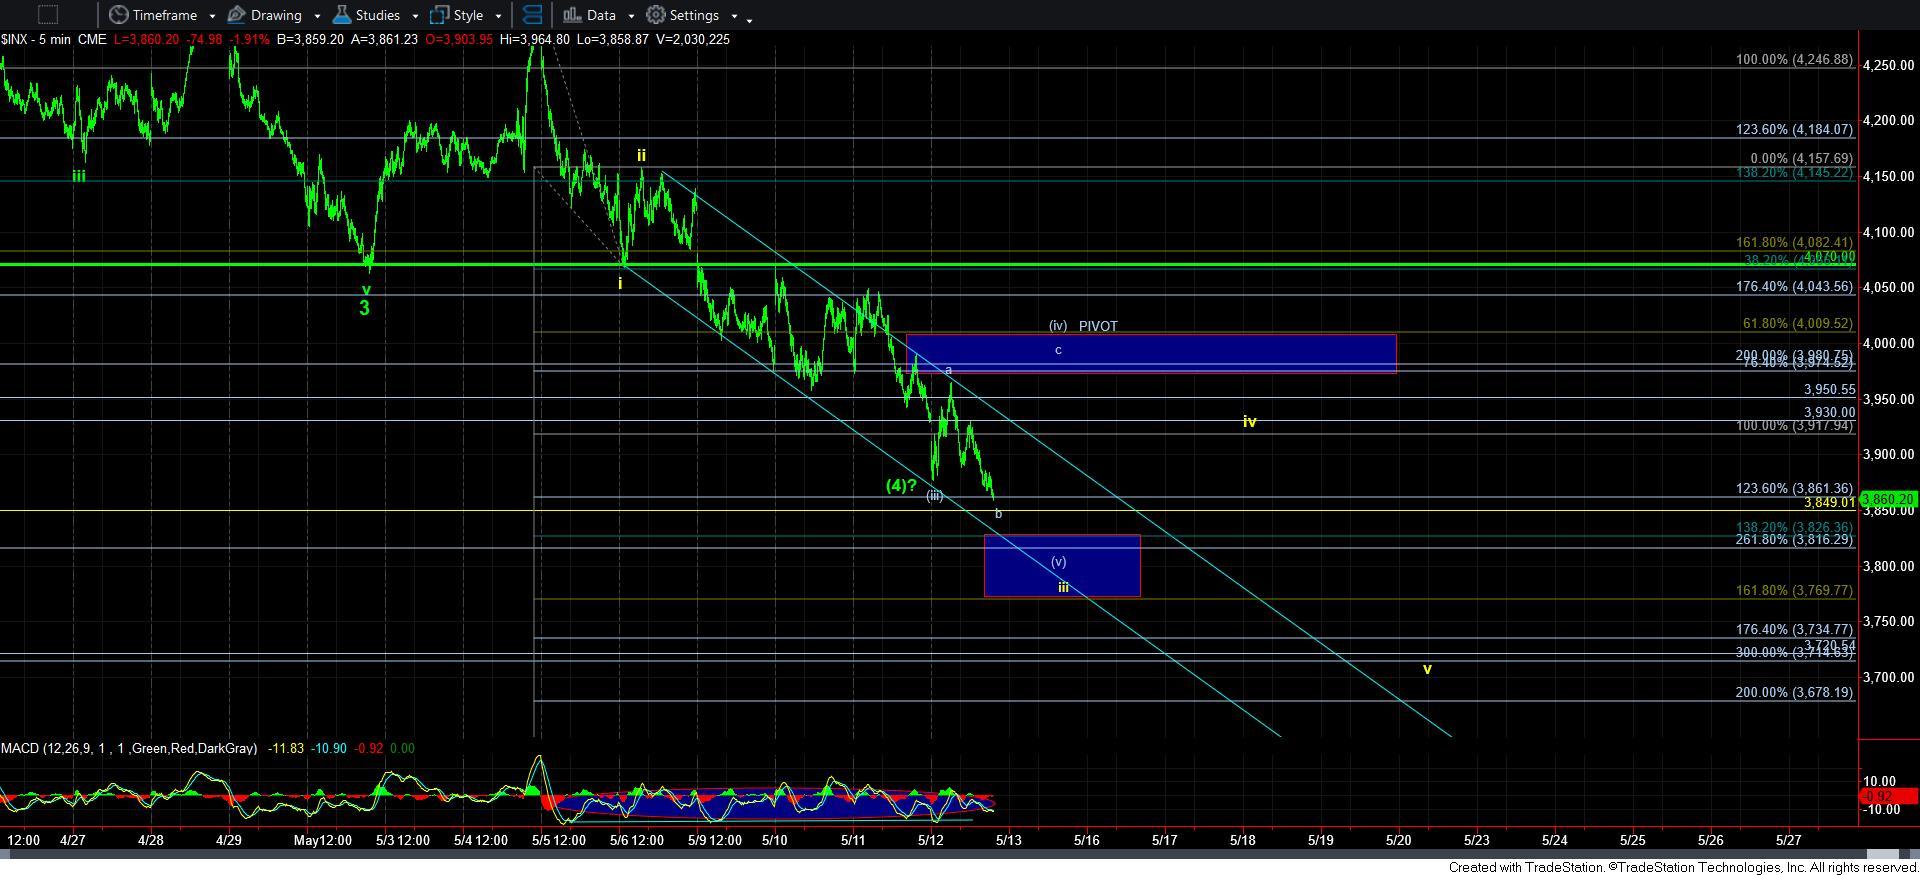
Moving to the smaller degree structure, I have to now view the market as being within an extended 5th wave down in this c-wave. And, as you can see from the 5-minute chart, I have added a market pivot. Until we are able to break out through that pivot – with the top of resistance being 4010SPX, pressure will remain down to complete these 5 waves which can take us down to the 3700SPX region. Should we see an impulsive move through this pivot before all 5 waves are completed, then I will consider this 4th wave as completed.
In the very smaller degree, I am now questioning whether this last move down today is a b-wave within the wave [iv] of wave iii in yellow, or if we are already in wave [v] of iii in yellow. Should we see a sustained break down below 3860SPX, then I would have to assume we are already in wave [v] of iii, with today’s bounce being all of the wave [iv] we will see.
In summary, until the market is able to climb back over 4010SPX, I cannot entertain an IMMEDIATE bullish count just yet, especially when we still have potential for further downside in this extended 5th wave.
But, in the bigger perspective, I still retain a bullish bias for new all-time highs, with my ideal target remaining at 5500SPX. And, with these extremes in bearishness which rival those seen in March of 2020, I believe we now have the fuel to get there.
Lastly, I want to make a point to all our members. I do apologize that I did not expect a pullback this deep. While I did have this yellow count on my charts for months now, I had always viewed it as a very low probability. So, again, my apologizes for not expecting this deep of a pullback.
Yet, while my analysis was wrong, I did provide 4 opportunities for those that followed my work to raise cash or hedge your positions, with three of them even being marked as DANGER ZONES. So, while I correctly expected a pullback in the market to start 2022, I clearly was not correct in my expectations of the depth of this correction. Yet, if you followed my suggestions on positioning, they were much more helpful and accurate than my actual analysis. And, at the end of the day, I believe that is more important.
But, now, I think we have to think in terms of where do we begin to add positions on the long side? And, for me, that is when the market provides us with an impulsive break out over 4010. I think that will be a safe signal at this point in time.


