Yellow Is Losing Luster
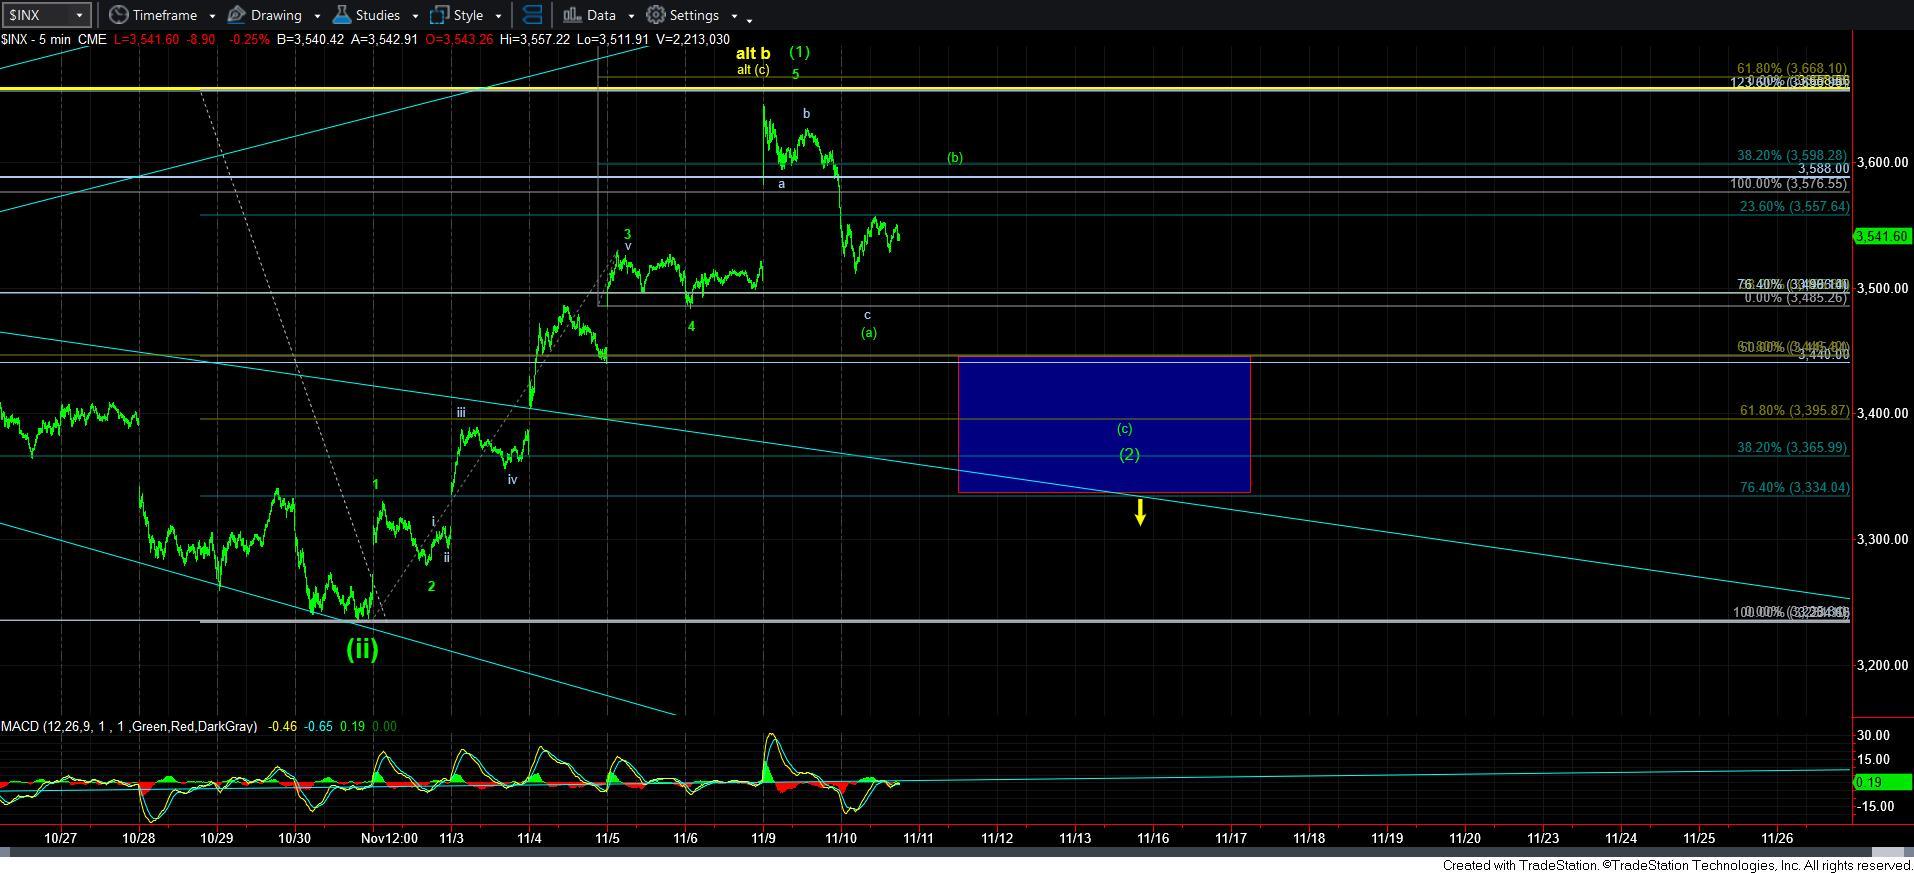
As I have been highlighting over the last two days, the action we are seeing in the market has made the potential for a deeper wave [ii] less and less likely.
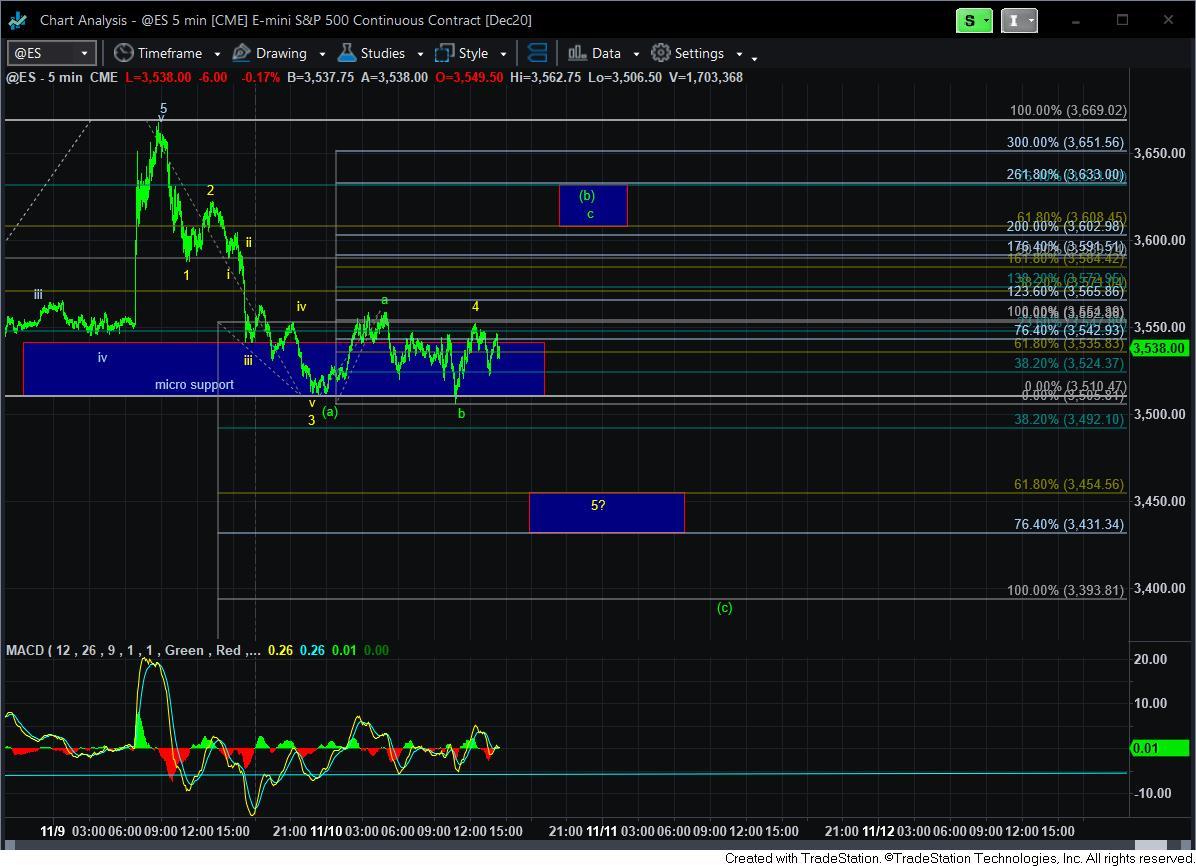
As you can see from the attached 5-minute ES chart, I do not have a count presenting us with a CLEAR 5-waves down off the high struck yesterday. And, in order to even consider the potential for the yellow count, I needed to see a CLEAR 5-wave decline.
Therefore, I have to reiterate that the green count must remain our primary at this point in time, as the yellow count has certainly been dropping in probability at this point in time. Should things change, I will certainly alert you to that potential, but as it stands now, the market is not providing us with any indications other than green.
In the meantime, as I noted yesterday, as long as the market remains below the 3660/70SPX resistance region, I am tracking a wave [2] potential pullback, as shown on the attached 5-minute chart. This remains my primary expectation.
From a the perspective of expectations regarding a wave [2] in SPX, normally the [a] wave of an [a][b][c] 2nd wave targets the .382 retracement region of the prior 5-wave structure, which is just above where we bottomed today thus far. And, after a corrective [b] wave structure, the [c] wave should take us down to our target below for a textbook wave [2] pullback.
But, I want to warn anyone who is attempting to short for any pullbacks – we are likely in a bull market, and on the cusp of breaking out within a wave [iii]. Therefore, surprises will likely come to the upside.
I want to also repost something I sent out within an alert earlier today, as I want to make sure everyone understands the bigger picture in the bullish pattern:
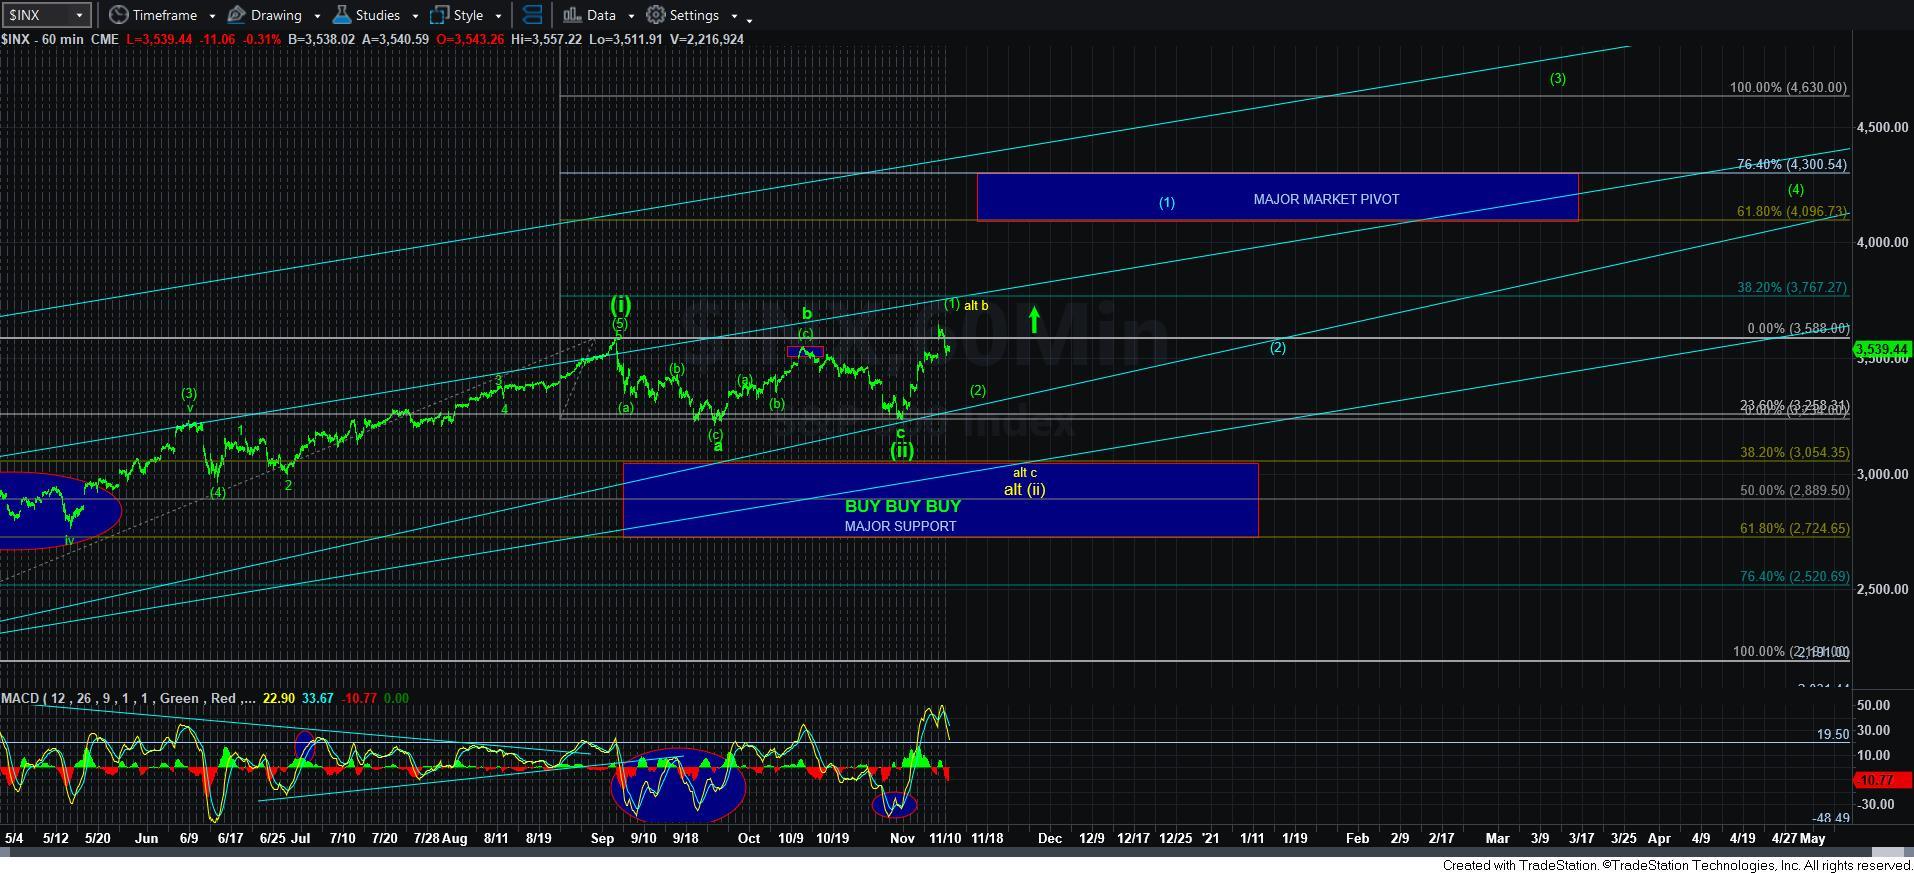
"I know I am a bit premature with this, but assuming that we get our (a)(b)(c) corrective pullback, I want to prepare you for the next major test overhead in the market. Assuming that wave (ii) is indeed done, I have added a MAJOR MARKET PIVOT to our 60minute chart. Depending on how the structure develops in the coming week or so, there is still potential that this rally structure is only waves i and ii within wave (1) in blue. I have mentioned this before, but I want to put it back on your radar to consider. Much will depend on how we rally after the Thanksgiving holiday and from where.
The benefit to having this blue (1)(2) play out is that it opens the door for wave (3) to not just target the 1.00 extension, but rather the 1.236 extension in the 4900/5000 region.
The main reason I am considering this is because wave (1) of (iii) often targets AT LEAST the .382 extension of waves (i) and (ii), but more likely the .618 extension. And, we have clearly come up short of those targets thus far. So, just putting this in the back of your mind to consider - - again, assuming we soon get confirmation that wave (ii) is done.
Lastly, one we move through this major market pivot in wave (3), it then becomes the major support in the market which points us up to 5000+."
So, in summary, as long as the market remains over the wave [2] support box on the 5-minute SPX chart, I have to view us as preparing for the next phase of the bull market off the March lows. And, should the market provide us with a more impulsive indications of an intention to follow through in the alternative in yellow, I will certainly alert you. But, for now, I am not seeing any indications as I do not even have an initial 5-wave decline. But, I will be tracking the micro structure in the ES to see if the market chooses to do so by tomorrow.