Will FOMO Take Over The Market?
With the market still holding over support and moving sideways the last several days, it still has provided no signal that it has topped.
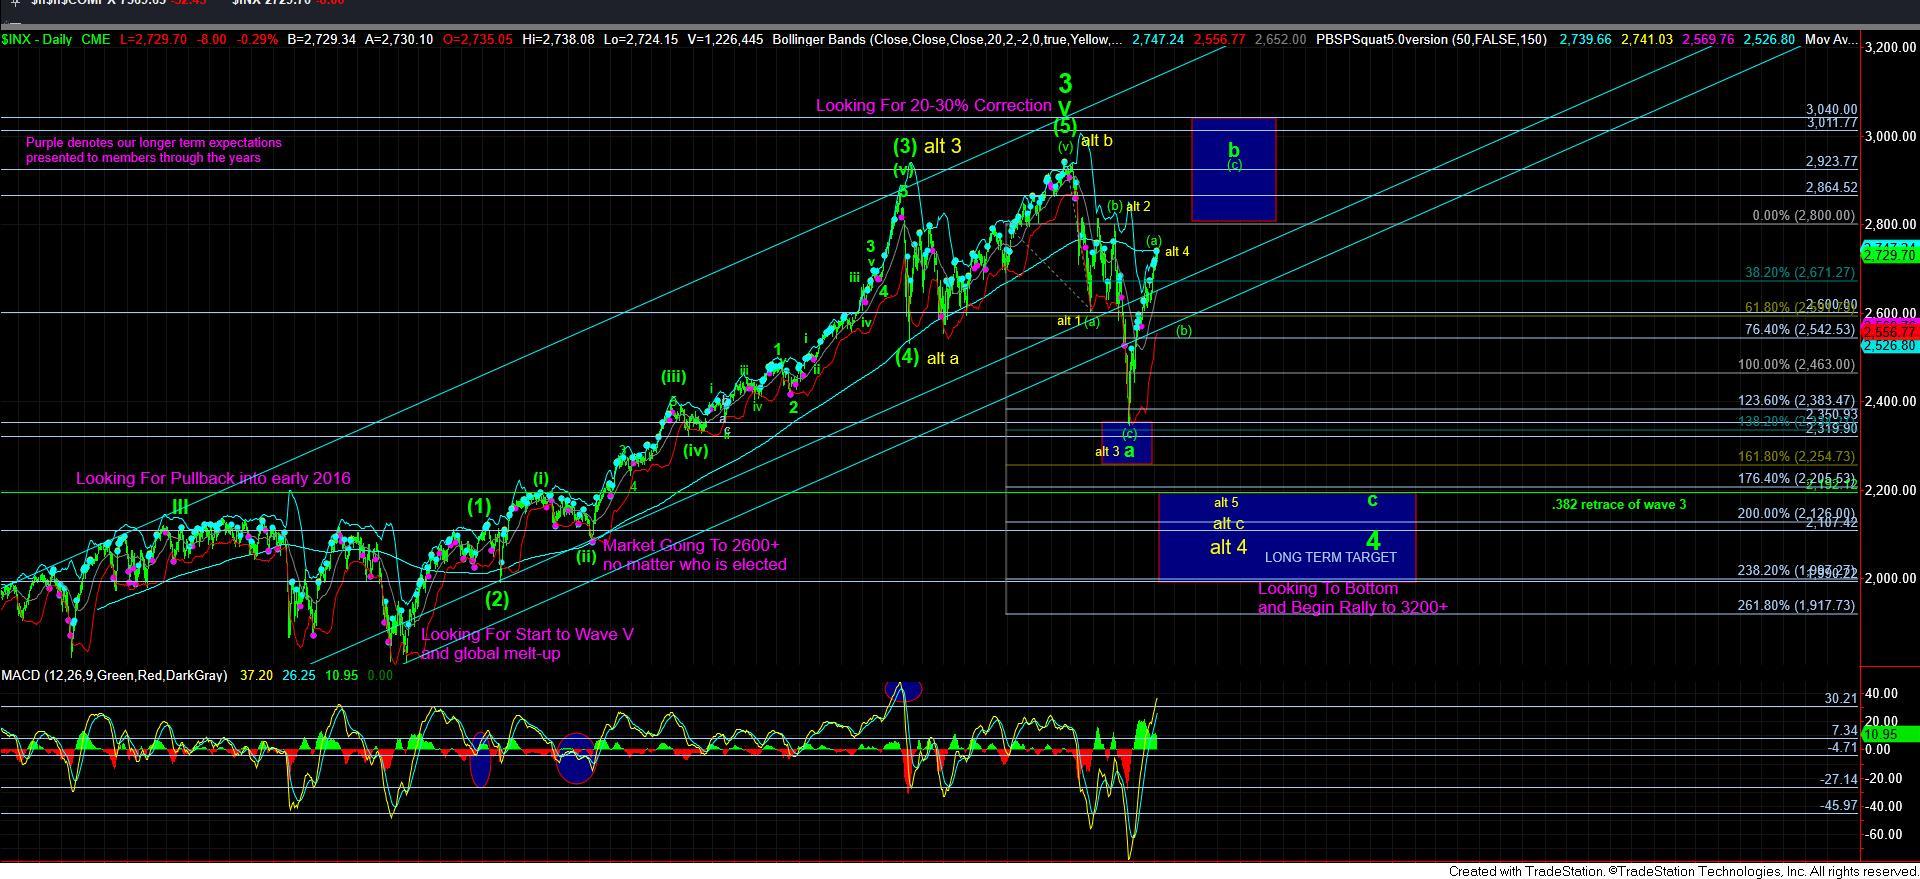
To remind you, at the end of last year, we set up a bottoming target between 2250 and 2335SPX. While we expected the market to provide us one more 4-5 within the downside count to complete in that region, the market bottomed in that region (in the futures) without that last 4-5. However, even before we bottomed, we started providing a target for the [a] wave rally we expected. At this point in time, the market has exceeded that target by approximately 50 points. However, our primary count still views us as topping in a VERY extended [a] wave off the December lows.
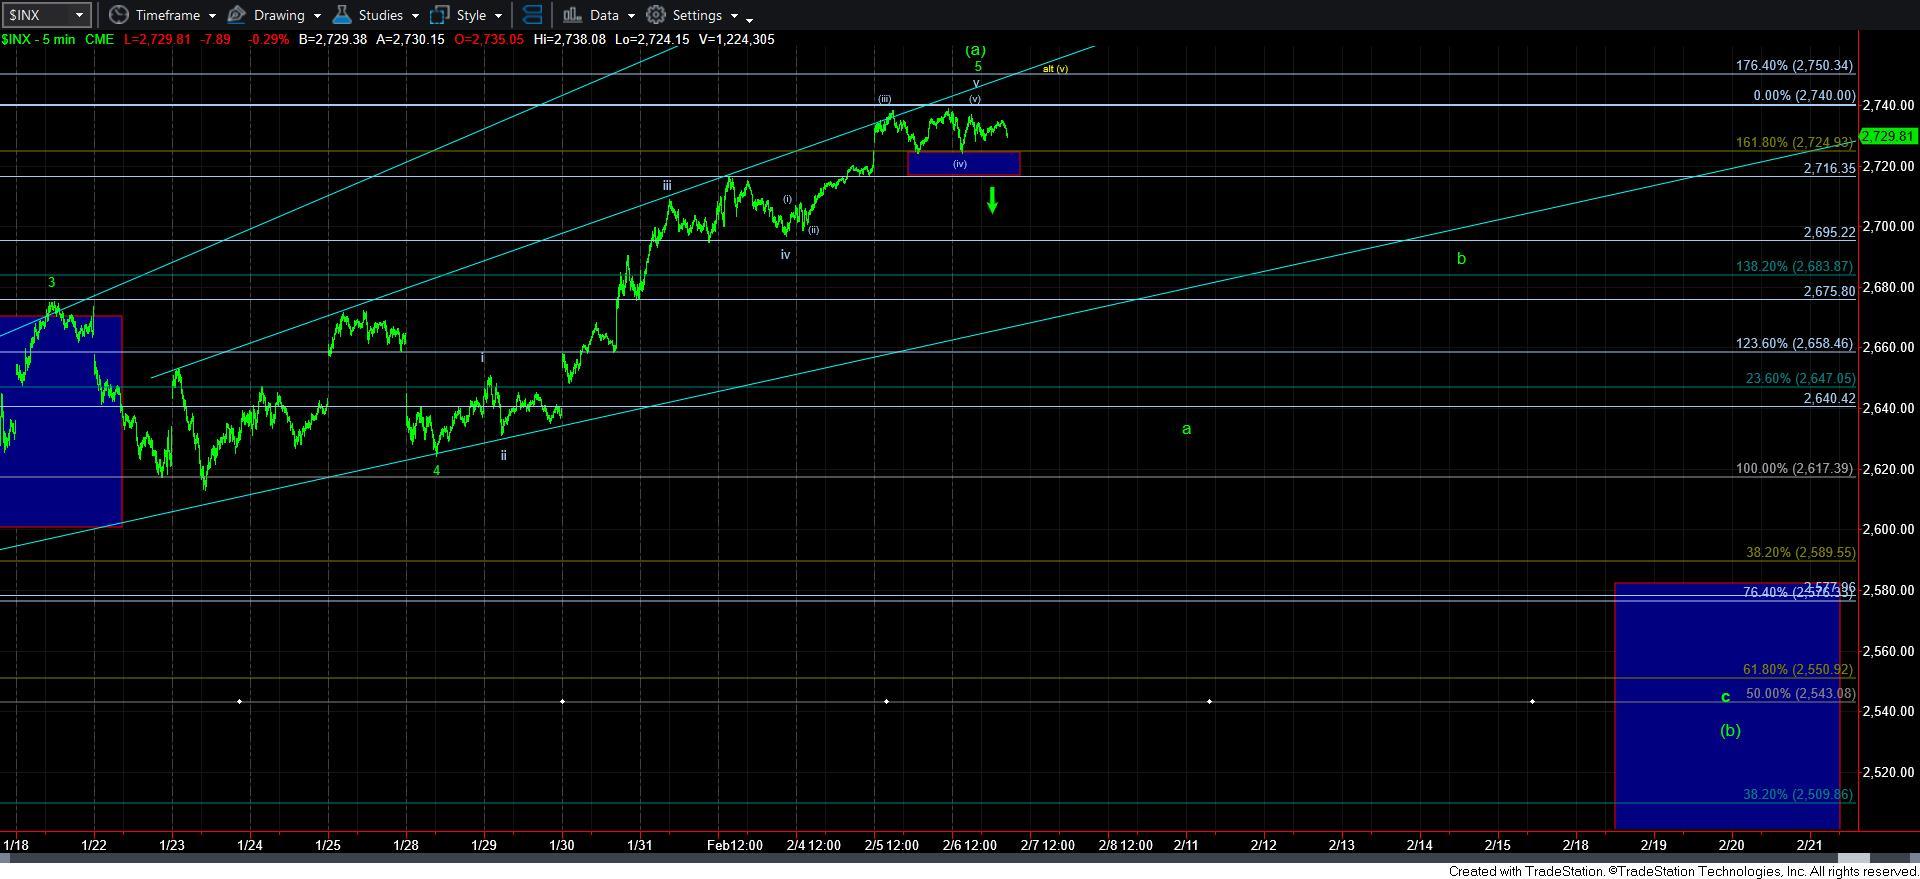
In the smaller degree perspective, it would take a break down below today’s low to provide an initial signal that this [a] wave has topped. And, as noted last night, we will need follow through below 2715 to really get things moving to the downside. However, if today’s low holds as support, then the market remains open to another extension in wave (v), as presented in yellow on the 5-minute chart.
In the bigger picture, if the market tops out within this region, and then pulls back to the .382 retracement region of the [a] wave in the 2600 region, it would point us to the 3000 region wherein [a]=[c] in that structure. And, for those that have been following me over the last few months, you would know that I had maintained an expectation that this b-wave will likely be quite large, with the potential to take us to the 3000 region. We may be seeing the set up for that potential building before us.
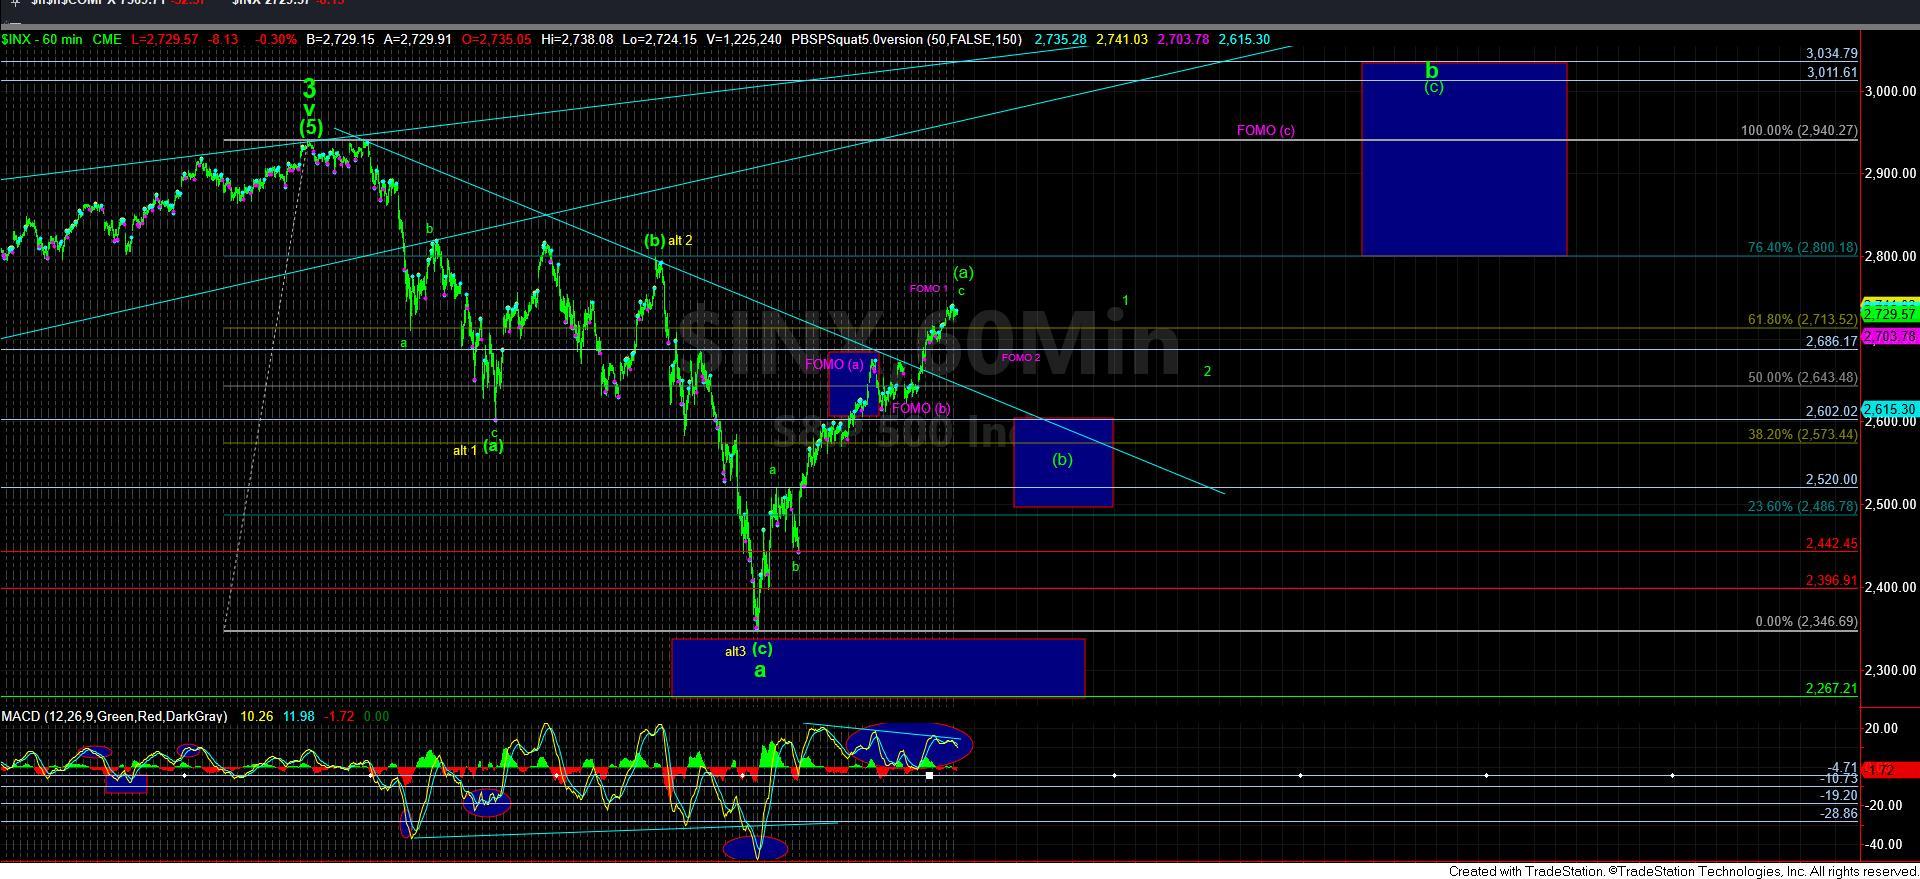
However, many have been developing a strong FOMO – fear of missing out. So, for you, I have presented the manner in which the market may continue to rally without seeing any more of a larger degree pullback, and it is presented in purple. Please recognize that this is only an alternative at this time, and one in which I cannot place any strong reliance just yet. The main reason I cannot take it seriously YET is because the [b] wave in this instance would be relatively too small for what we normally see in a [b] wave of this magnitude.
However, if the market tops out in this region, and is unable to break down below 2680, and then rallies back over the high we develop in this region, then I will have no choice but to adopt this alternative, and view us as rallying back to the 2940 region in a more direct fashion. Again, this is represented by the purple count on the 60-minute chart, and is merely an alternative at this point in time.
For now, I still believe the most likely path is lower as we look into next week. But, first we need to break today’s low and follow through below 2715SPX. And, that should lead us to the [b] wave pullback we ideally seek.
However, if that [b] takes shape as an a-b-c structure which only points us down to the 2600SPX region, then I will be looking higher to the 3011 region in earnest for a target to complete this b-wave rally, as we had initially suspected could happen many months ago. Moreover, consider the bullishness which may be seen at those levels, with nary a person giving any consideration to a move back down to the 2200 region there. This could be one of the most evil scenarios seen in recent memory.