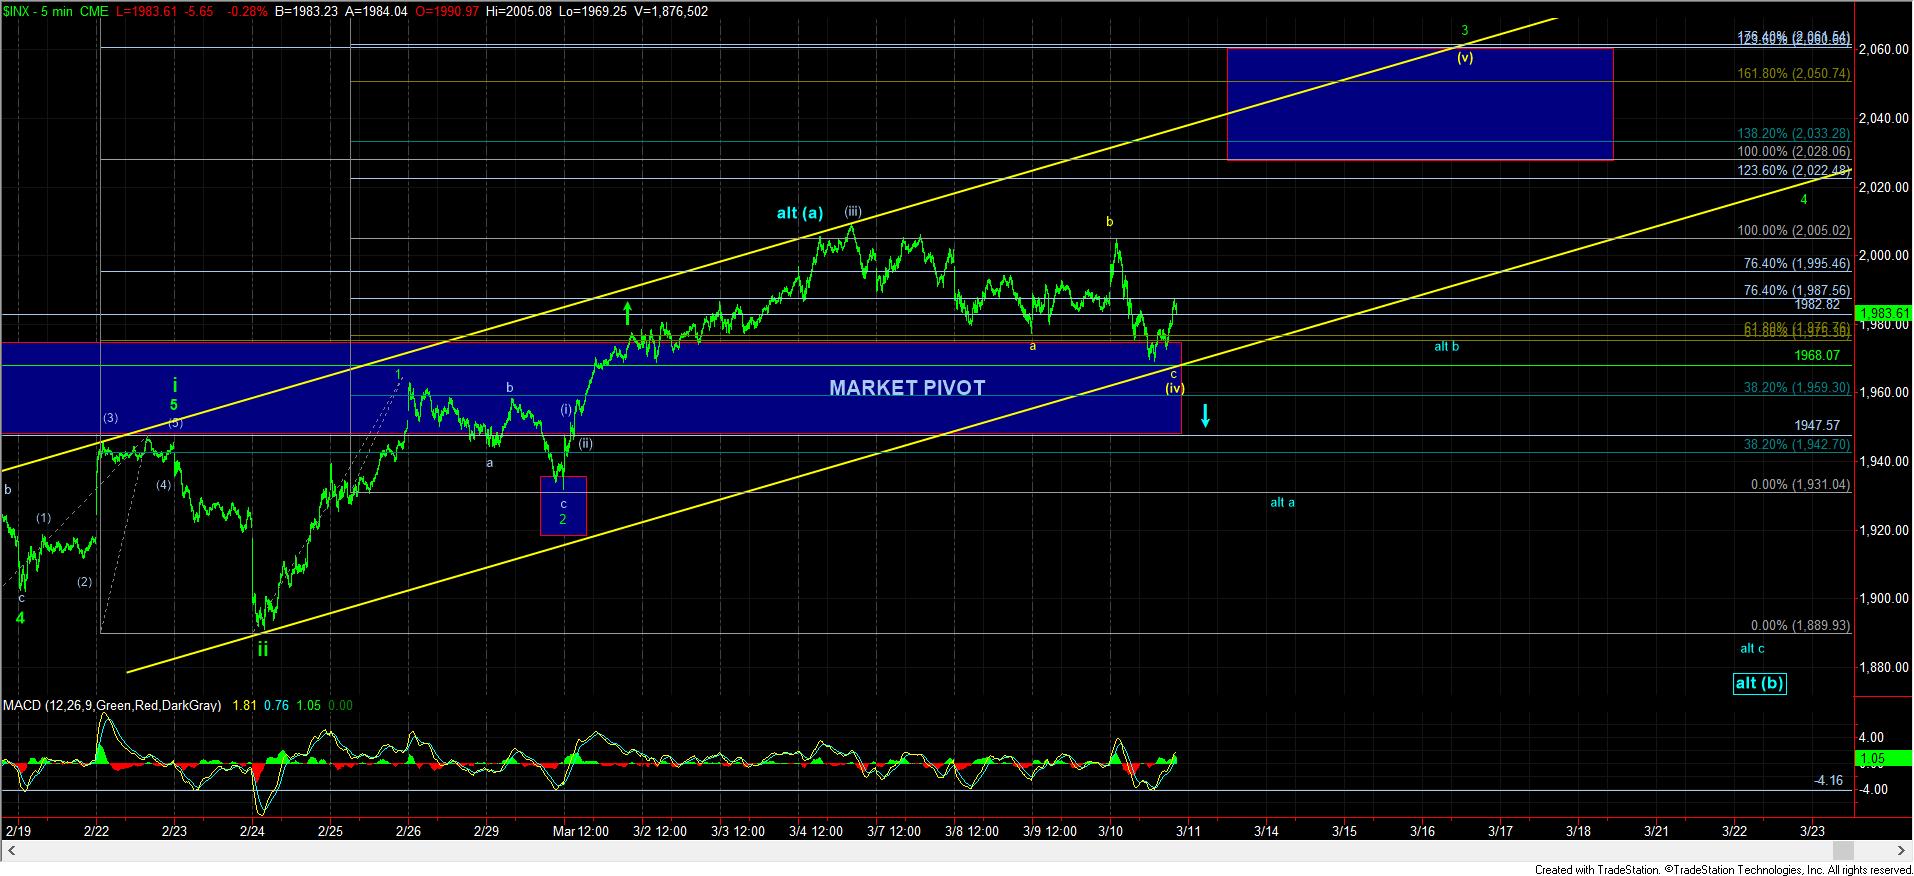
Where Market Decides Between Bulls and Bears
While the market rallied off yesterday’s low, the move higher was overlapping and corrective. It led us to identify a potential b-wave high just below the prior high. Moreover, it became quite clear that the market was going to come down and test the main support for the bullish pattern.
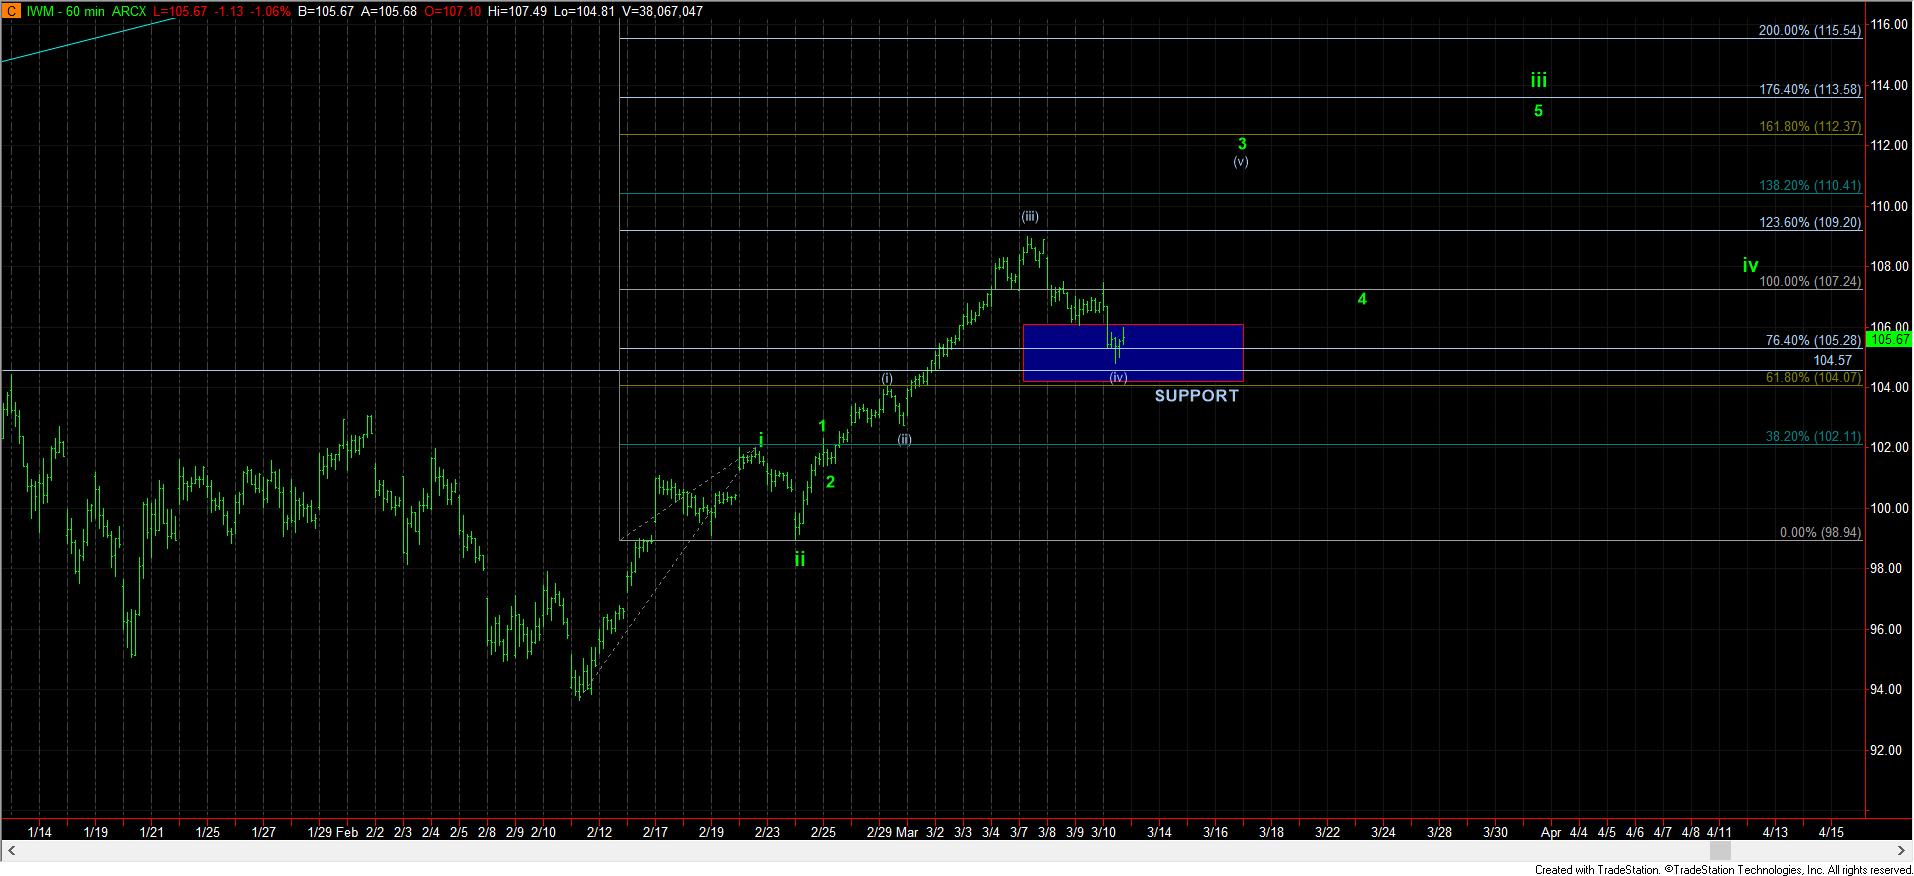
As you can see, before we began this decline today, I had to modify the support a bit in IWM to the .618 extension, which was just below the level where an a=c would project towards in a bigger wave (iv). And, thus far, it has held.
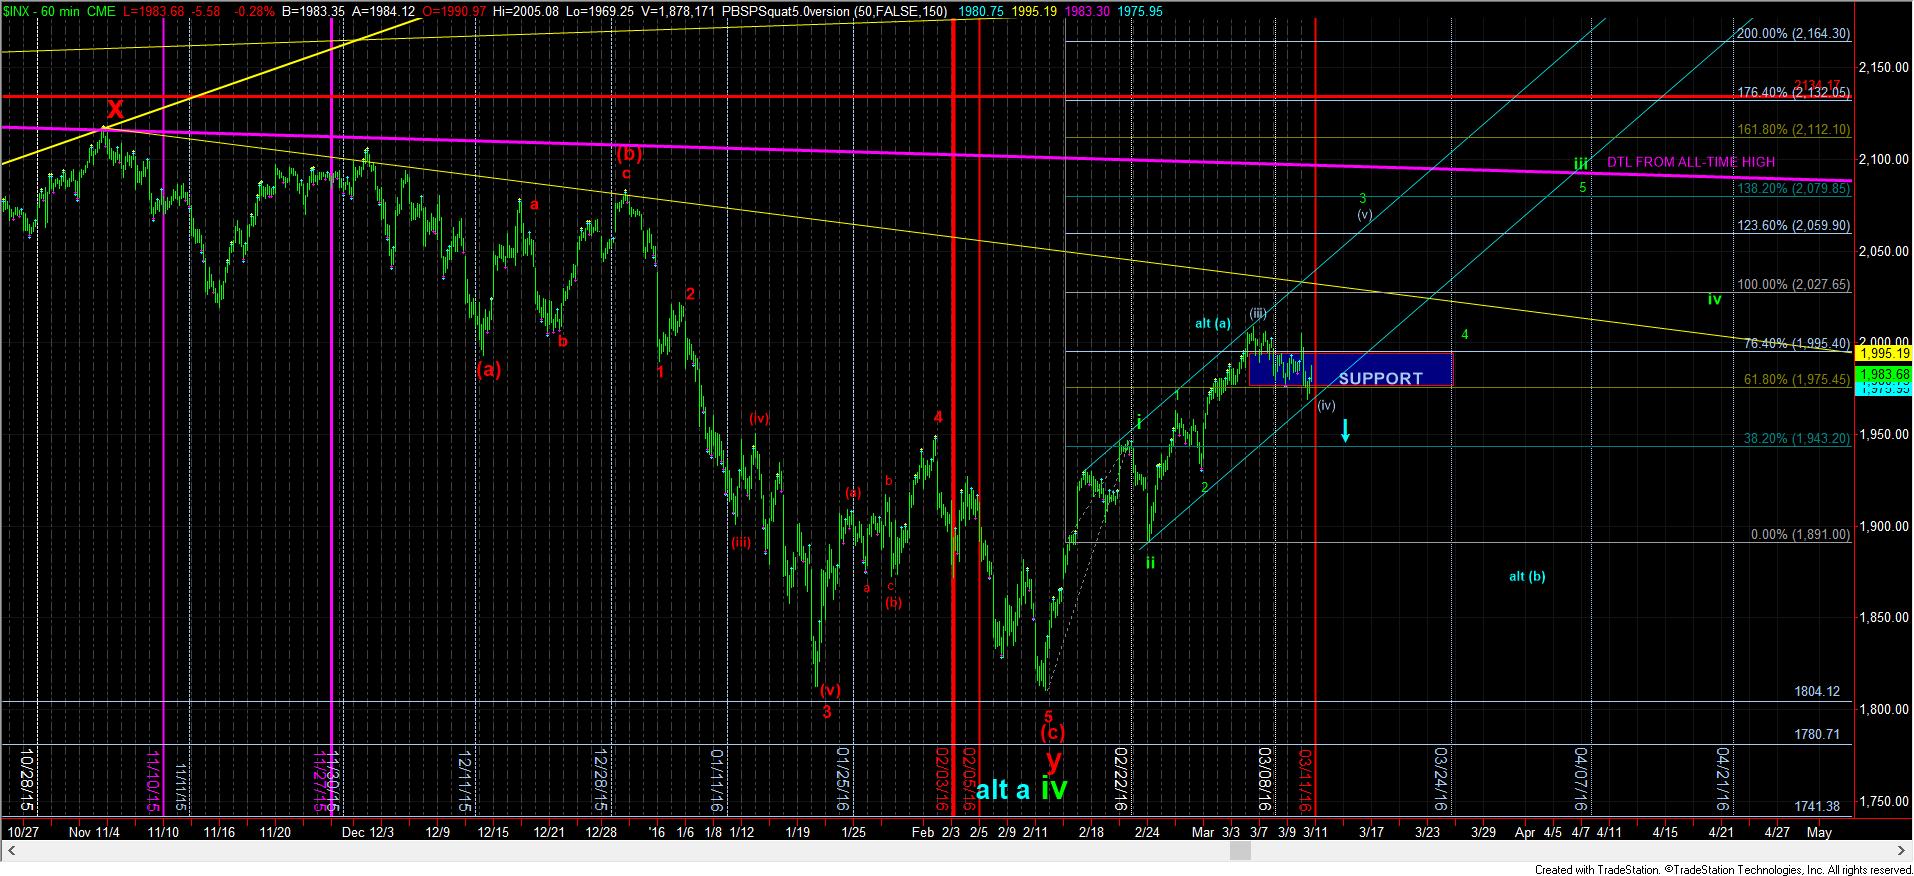
Additionally, the SPX has come down into our 1968SPX support level, but has still not provided us with a clear 5 wave structure off that low. We will need to see a 1-2 structure off the low with a rally over the high of wave 1 to confirm that we are heading up in wave (v) of 3. Moreover, due to the depth of the pullback, it has opened the potential again that we can head up as high as the 2060SPX region again. But, that is too early to determine just yet.
For now, as long as support holds, I am still going to expect higher. However, if we break 1968SPX, and follow through below 1959SPX, that puts me squarely in the blue/bearish count, and it will make the market action exceptionally difficult to follow over the next several months, and will ultimately lead us back down into the 1700’s in 2016.
So, as amazing at it may sound, this little region truly means so much to the bigger trend, at least in my humble opinion. I guess that is why it has been labeled as the "market pivot."