Where Are We?
Well, the break of 4400SPX adds extra probability points to the side of us heading down to the 4230-4274SPX region in the coming weeks. That is the simple part.
Before I begin, I want to note that our resistance now is 4401SPX. And, I have two counts suggesting that as resistance. So, let’s get to it.
First, despite the rally on Tuesday afternoon into Wednesday morning throwing me off a bit, I posted this summary as an alert on Wednesday morning:
“I am leaning to the downside as long as we remain below 4465SPX. Over that level, and then I have to turn somewhat neutral. And, over 4512SPX, then I have to be bullish looking for 4800SPX. And, below 4400SPX, then I have to be looking for 4230-74SPX.”
Today, we decisively broke 4400SPX. But, I am still struggling with how to account for the rally we experienced Tuesday afternoon into Wednesday. So, I am tracking two ways going forward. And, I strongly urge you to review each chart with the write up below. But, know that both suggest that 4401SPX is our main resistance.
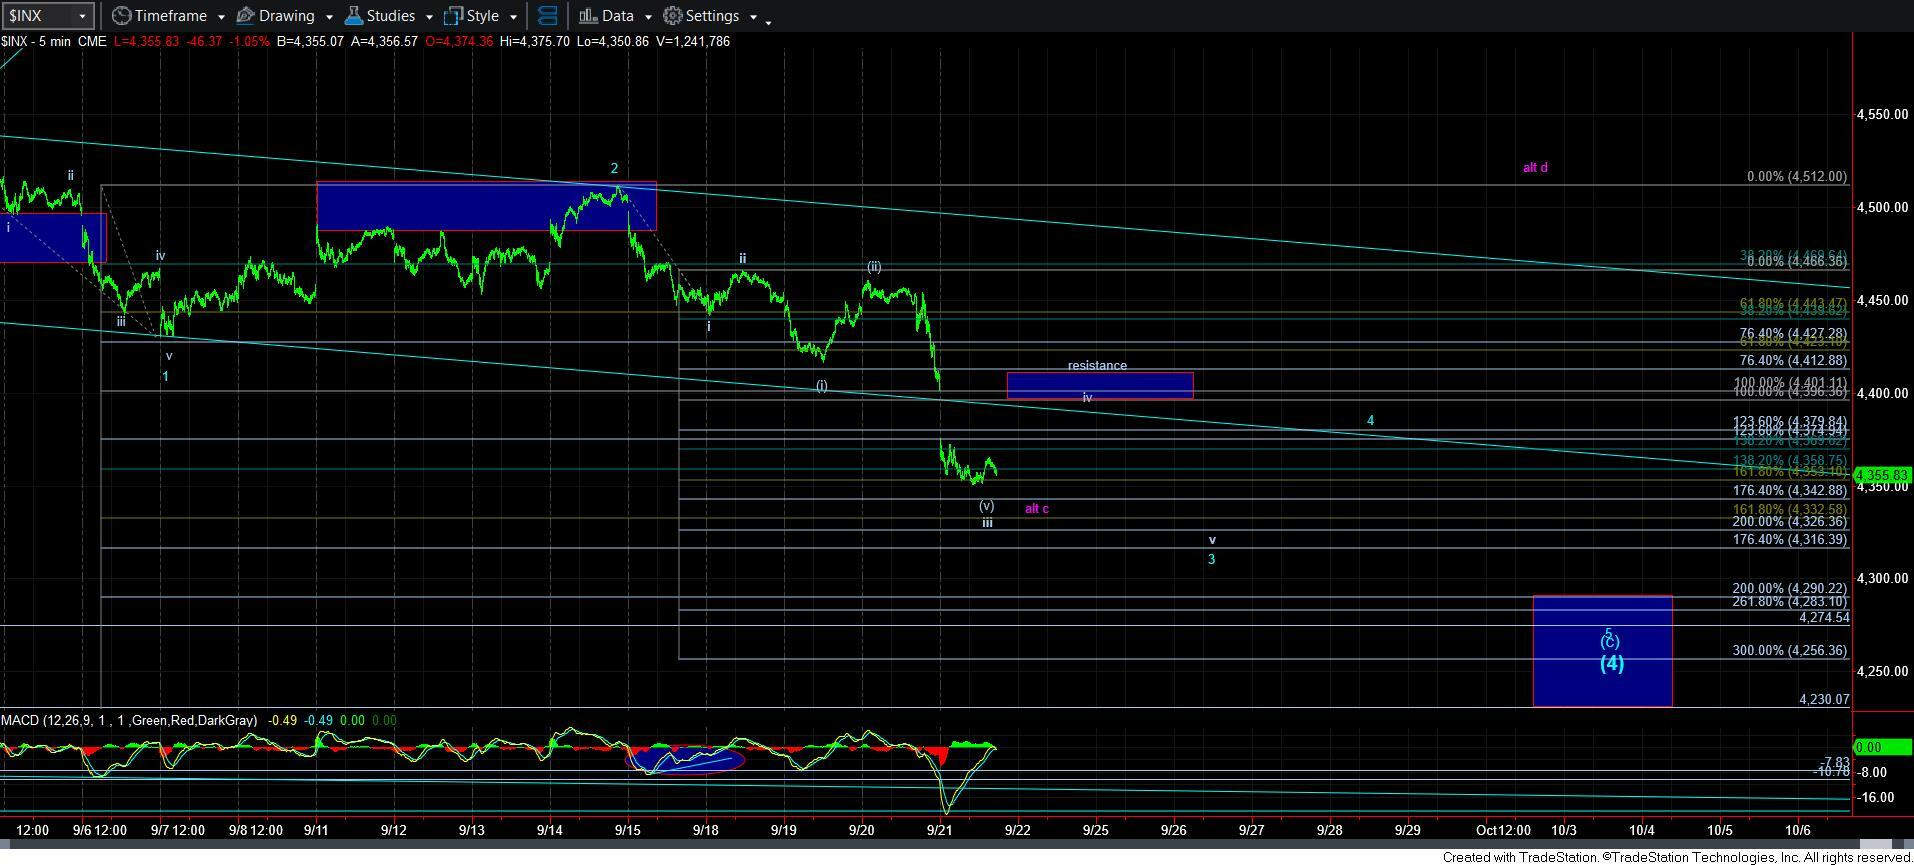
If we start with the SPX chart, you will see that I am accounting for the Tuesday/Wednesday rally as a VERY deep wave [ii] retracement within wave iii. You will see that today we came down to the 1.618 extension of waves i-ii, which is the typical target for wave iii. And, while we really cannot identify waves [iii] and [iv] in the wave iii in SPX, we can see it in the overnight session. So, now that wave iii of 3 dropped to the 1.618 extension, we would expect a bounce in wave iv of 3 back to the 1.00 extension, which is the 4401SPX region. Of course, we can still drop down towards the 1.764 extension in the 4342 region if wave iii is not done yet. But, I would still expect 4401SPX to hold as resistance on an ensuing wave iv bounce thereafter.
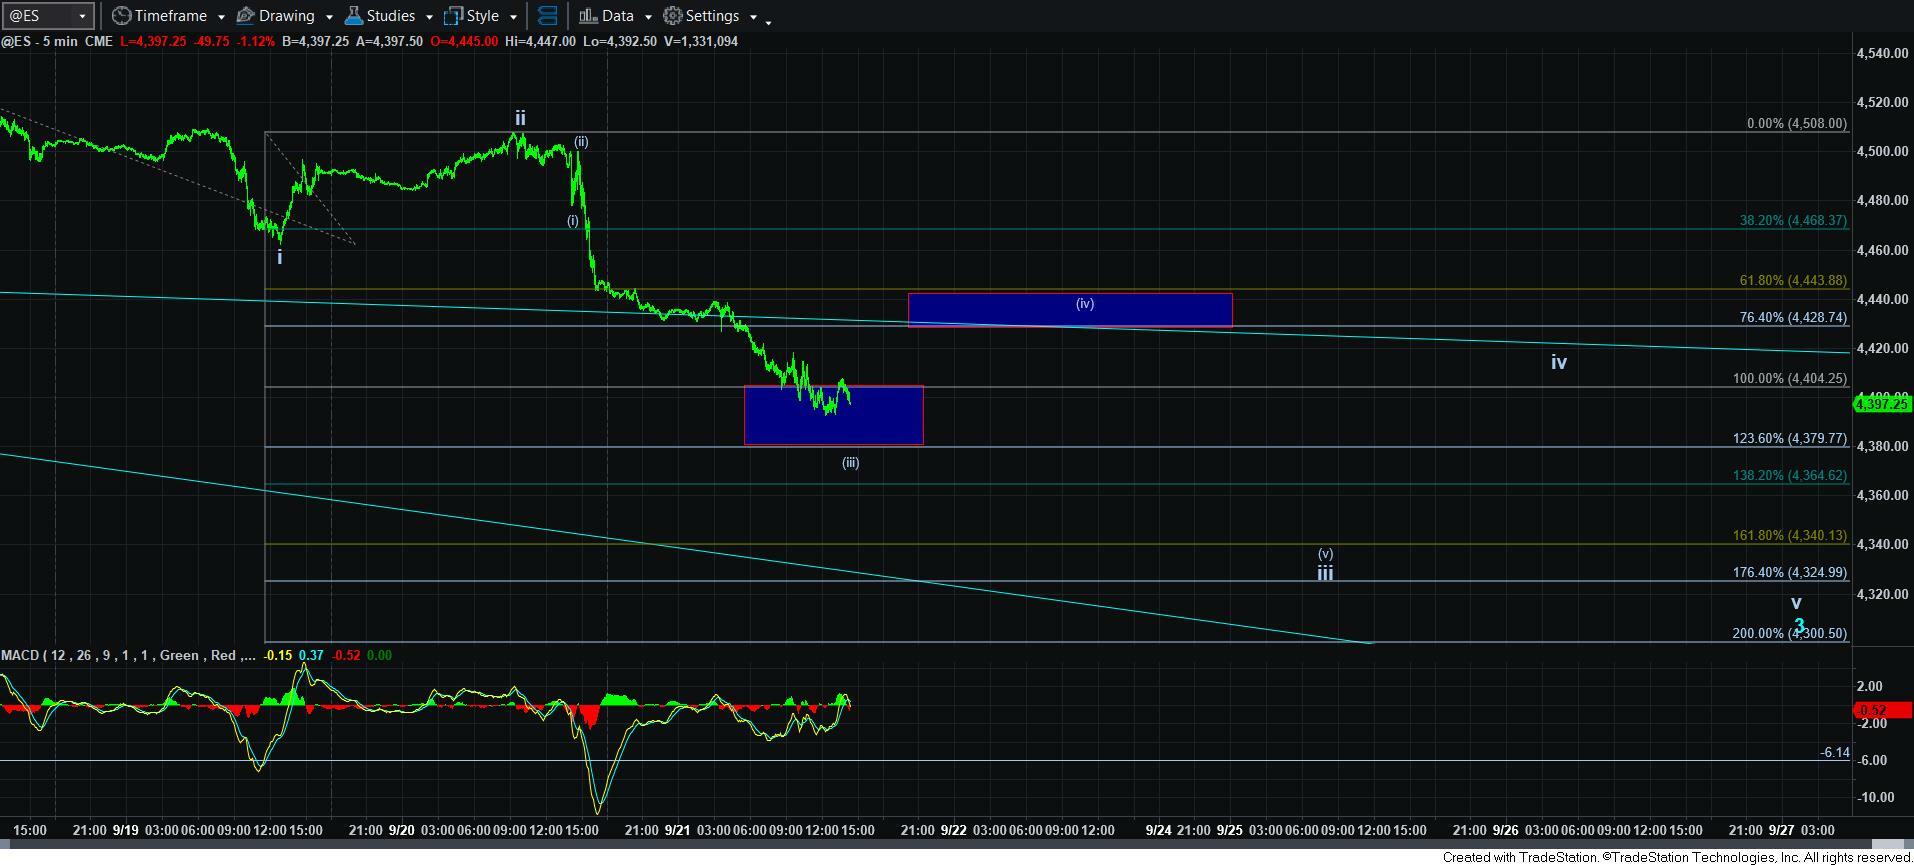
Now, let’s look at the ES, wherein I have accounted for the Tuesday/Wednesday rally a bit differently. As you can see, I accounted for the deeper drop into Tuesday as a more extended wave i and the ensuing rally as wave ii. Of course, there are just as many issues with this way of accounting for the Tuesday/Wednesday rally as there is in the SPX, but both are a reasonable way to account for it. This suggests that we are only completing wave [iii] of iii of 3 at this time.
Since we have dropped to the region between the 1.00-1.236 extension of waves i-ii (a typical target for wave [iii] of iii, I would not expect us to rally beyond the .618-.764 extensions of waves i-ii, which is highlighted by a blue box marked with a wave [iv[ in the 4428-4444ES region. And, since ES is approximately 42 points higher than SPX, it still brings us back to the 4401SPX region as our main point of resistance under both scenarios.
I am leaning more towards the count in the ES. However, should we complete the SPX structure as shown, I would likely consider buying as that completes, and leave a little dry powder in the event the ES gives us another 4th and 5th wave. Moreover, I think the ES structure takes us to our 4230-4274SPX region target in a cleaner way.
So, what I am now saying is that I am expecting us to have either bottomed or have one more lower low, and to see a bounce begin by tomorrow, if we have not already begun it. And, our main resistance is 4401SPX under both scenarios.
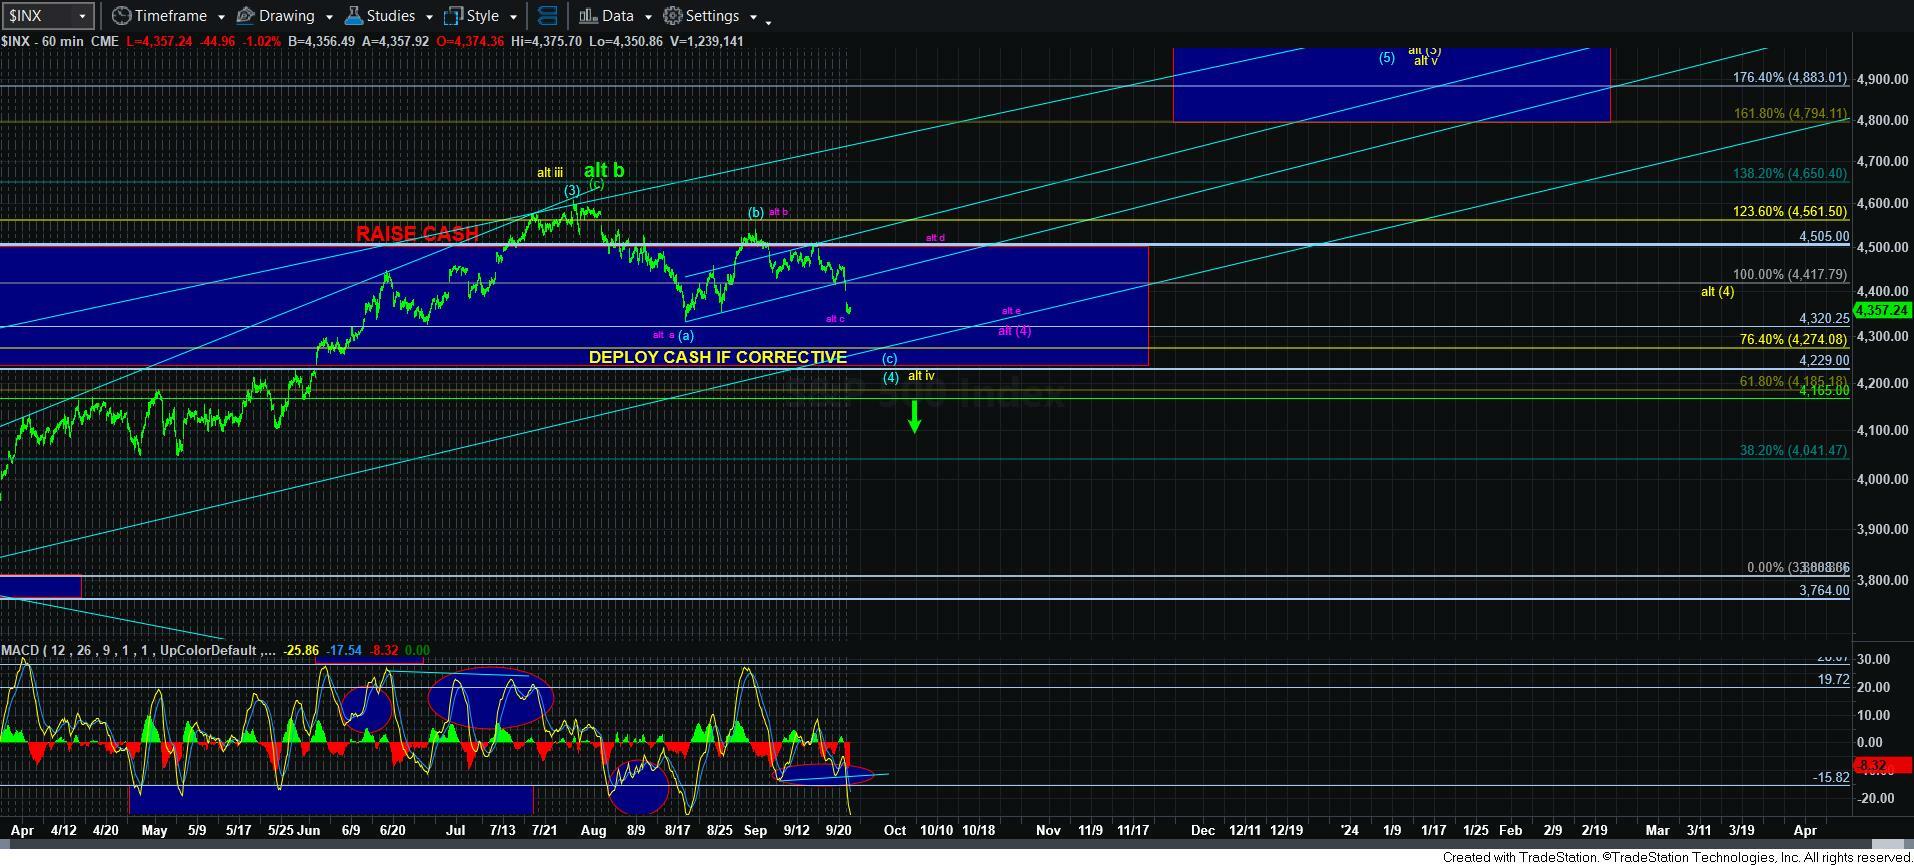
As far as alternative counts go, I have modified the alternative I was showing in purple and it now represents a 4th wave triangle. I posted an alert about this earlier:
“I am changing the purple alternative due to the depth of this drop. So, let me explain the parameters.
First, 4335SPX MUST hold here. Second, we have to break out over the resistance box noted on the 5-minute SPX. Should we see that happen, then I am going to view the purple as a triangle for wave (4), with the d-wave and e-wave still needed to fill out.
But, I also want to note that we do not see triangle very often at this degree. So, remember, this is simply an ALTERNATIVE which has to fulfill two pre-requisites noted above before I adopt it. For now, expectations remains for the 4230-4274SPX region.”
So, in summary, as long as the market holds 4401SPX, I am going to continue to look down towards 4230-4274SPX. And, it is not unusual to see the market go back up to test from below the level from which we just broke down. Again, assuming it is a successful test, then I continue to look for us to subdivide lower for at lest two more lower lows (SPX chart) and possibly three more lower lows (ES chart).
Lastly, I want to again remind you that there is no difference between the yellow and blue counts at this time as they will only diverge after a rally to the 4800SPX region is completed.