When You Get To A Fork In The Road – Take It
That is about where the market is as I write this update. With the move through the 3374ES level, the market has now placed two equally probable paths before us, at least as I can see it.
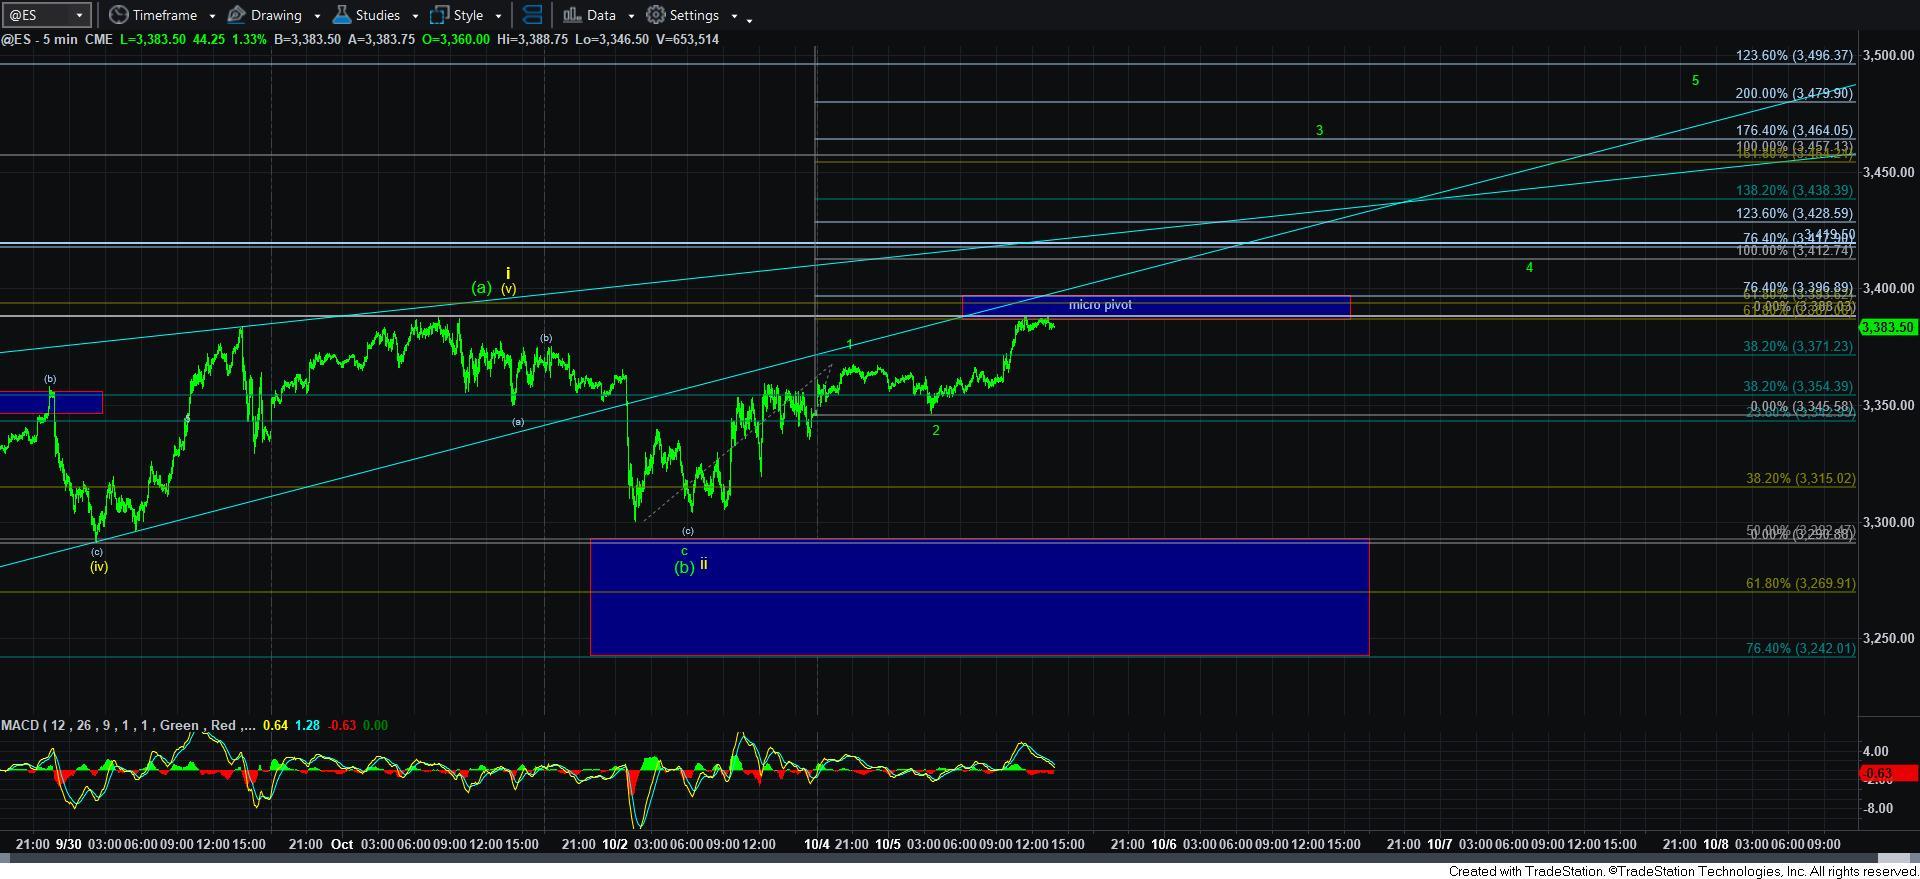
I have outlined the more immediate bullish potential on the attached ES chart. But, it relies upon a very shallow [b]/ii pullback. Moreover, the rally off that low is overlapping and can only count as a leading diagonal. And, for those of you that have followed my analysis for some time, you would know that I do not rely upon leading diagonals most of the time for strong trading cues.
As you can see, we have a market pivot on the ES chart between the 3387-97ES region. Should the market break out through that pivot, then it becomes support for the more immediate bullish count pointing us into the 3450-3500SPX region for the [c] wave of the b-wave in green. In this set up, it would point us towards the upper end of that target region.
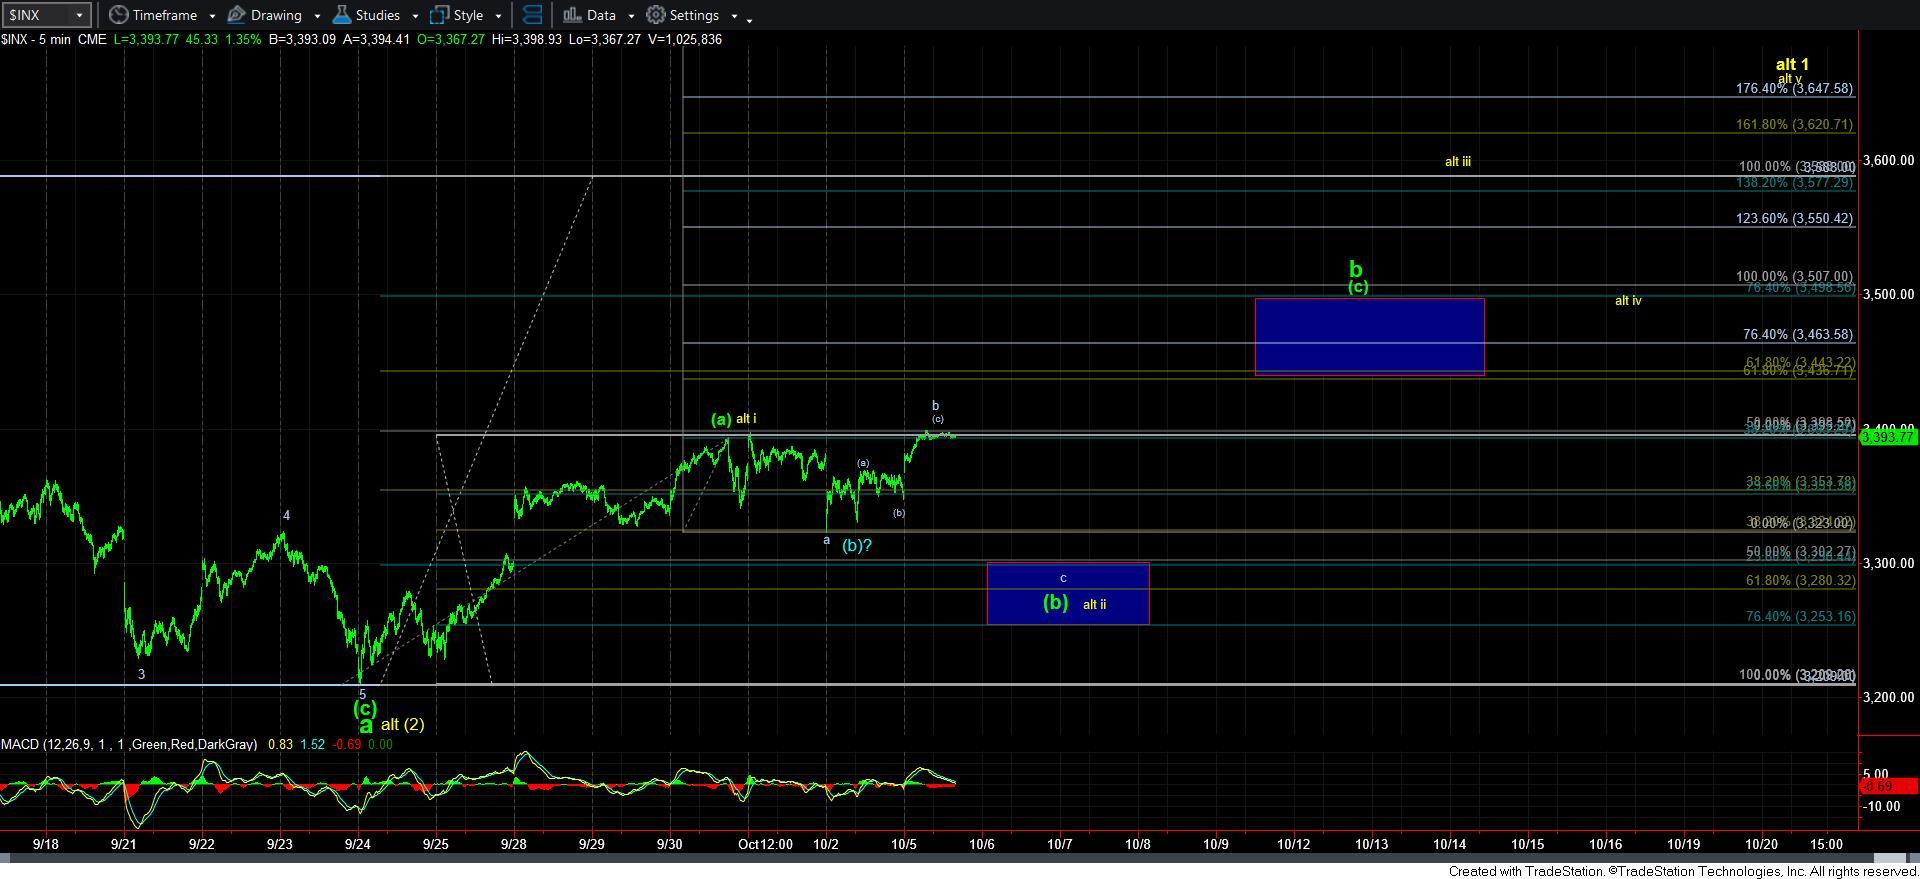
However, if the market is unable to break out through this pivot region, then the count presented on the 5-minute SPX chart is applicable, and points us to a more protracted [b]/ii structure, which can still take us to the lower blue box on the 5-minute SPX chart before we rally up to the upper blue box target for the larger degree green b-wave.
Again, in weighing the various counts, I am 50/50 as to which path the market will take to our upper blue box target. But, should we break out through the pivot, then it is clear we are already in the [c] of b rally. Personally, I would much prefer another swing lower, as the market feels like it is moving too fast through this potential b-wave structure. But, as always, I will follow price.