When Does The Long Side Become “Dangerous?”
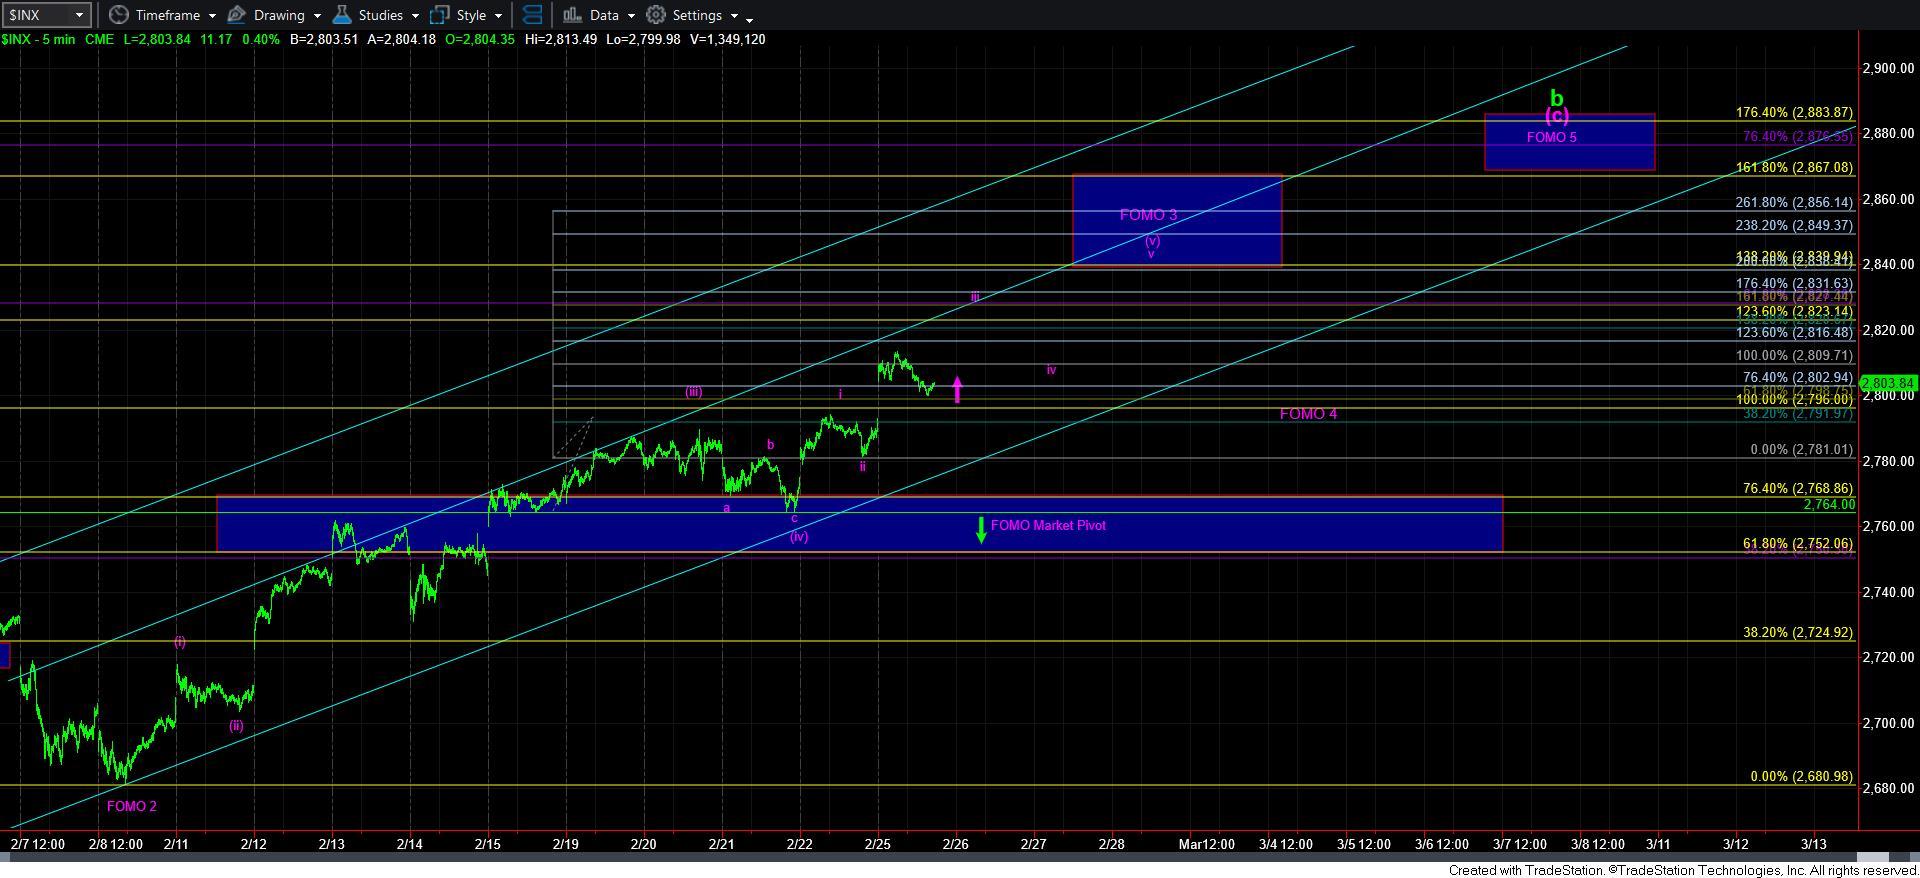
With the market continuing to push higher in the FOMO impulsive count, we have now moved up over the 2800SPX region, and can be targeting the 2830 region for the wave iii of [v] of 3, as shown on the 5-minute chart. So, as long as 2798SPX holds as support, that will be my expectation for tomorrow.
However, if the market breaks down below 2796SPX, that is going to be a short across the bow for the bulls, and would suggest is has become “dangerous” to be long. While it does not confirm that the top has indeed been struck, it does suggest that trying to trade for higher has become more dangerous than it is likely worth. A break down below 2796SPX would suggest that the only way we see a higher move in this FOMO count would be as an ending diagonal, and those are never reliable to try to trade for that final 5th wave higher.
So, for now, I am still looking higher as long as we remain over the 2798SPX region, with the 2830SPX region being the target for wave iii of [v], and support then moving up to the 2810SPX region for wave iv of [v], with the ultimate target to complete the wave v of [v] of wave 3 in the FOMO count in the 2840SPX region.
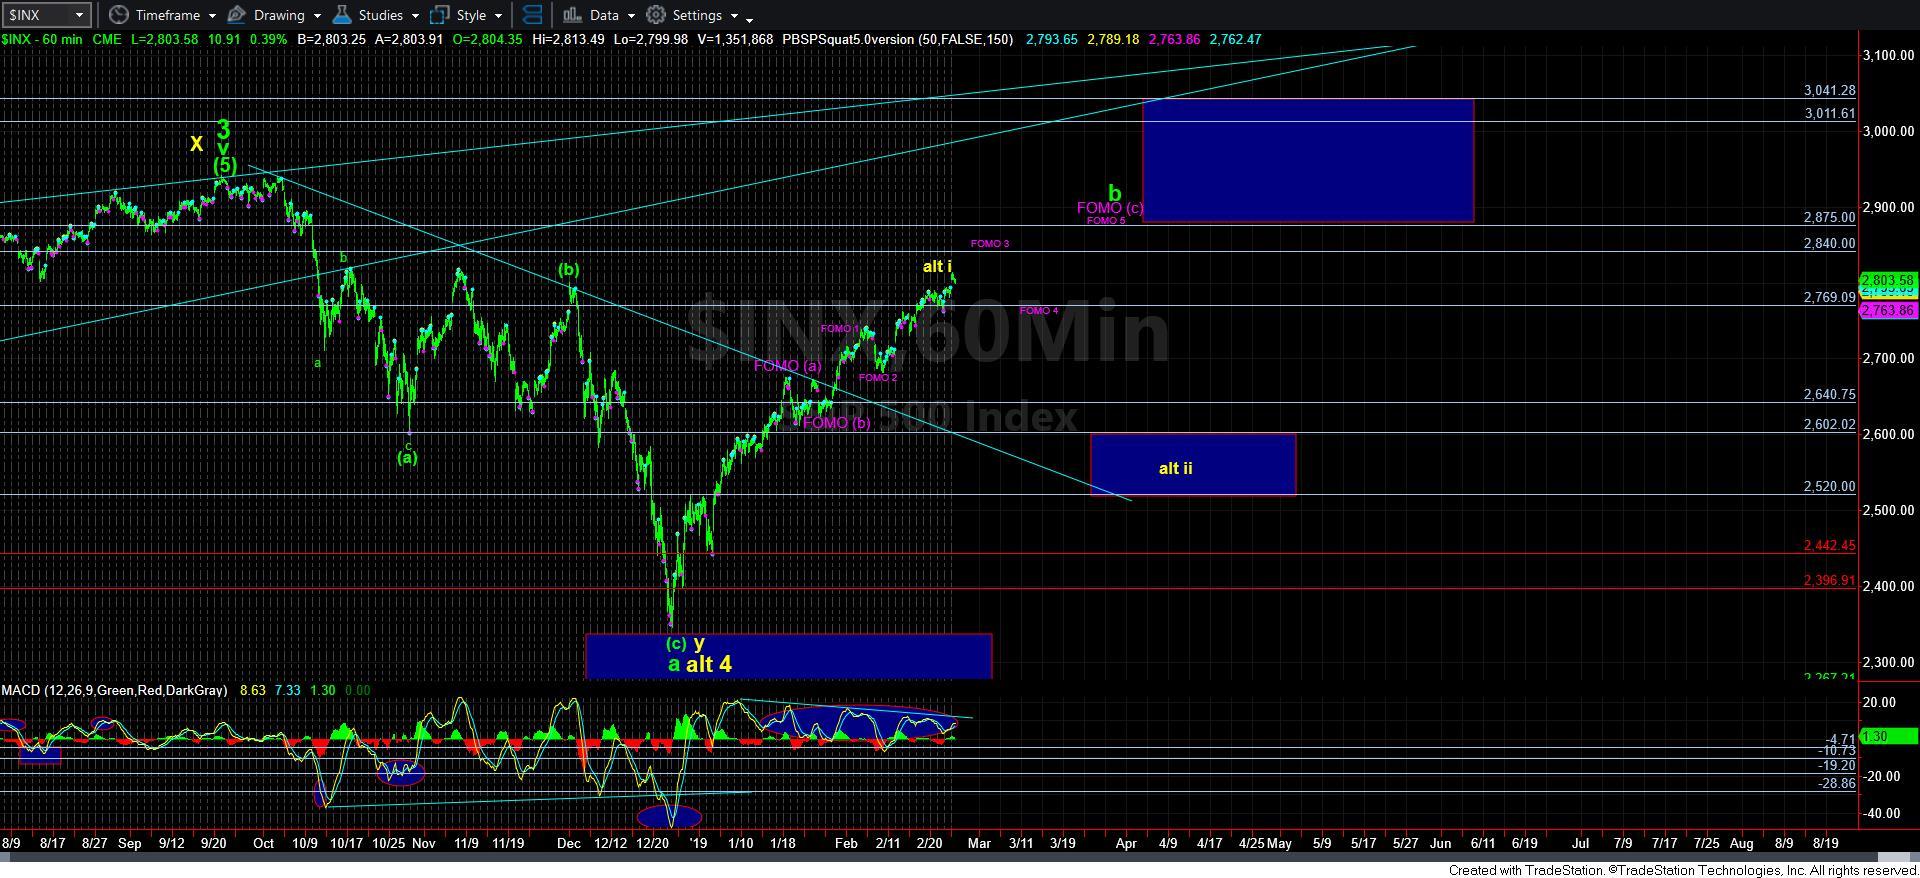
Since the market has come up this high, I now see this rally as likely being all of the b-wave, with an ideal target still in the 2875SPX region.
However, should we not be able to exceed the 2820/30SPX region, and we begin to break down, I will have to begin to consider a more bullish “alternative,” but it MUST be proven to me in order to even consider adopting it. I can going to reprint the alert I sent out this morning about this “new alternative:”
Before I even begin this post, I want to make this VERY clear that this is what I am left with now as an ALTERNATIVE count, most specifically if the market continues higher this week. Since I always need an alternative count in the event my primary count is wrong, this is all the market is leaving me with at this time, so I am compelled to present it to you well before it increases in probability. Again, this is simply to present an alternative in the market, and it is not my primary count. Yet, I will now explain what will make this a higher probability in the coming months.
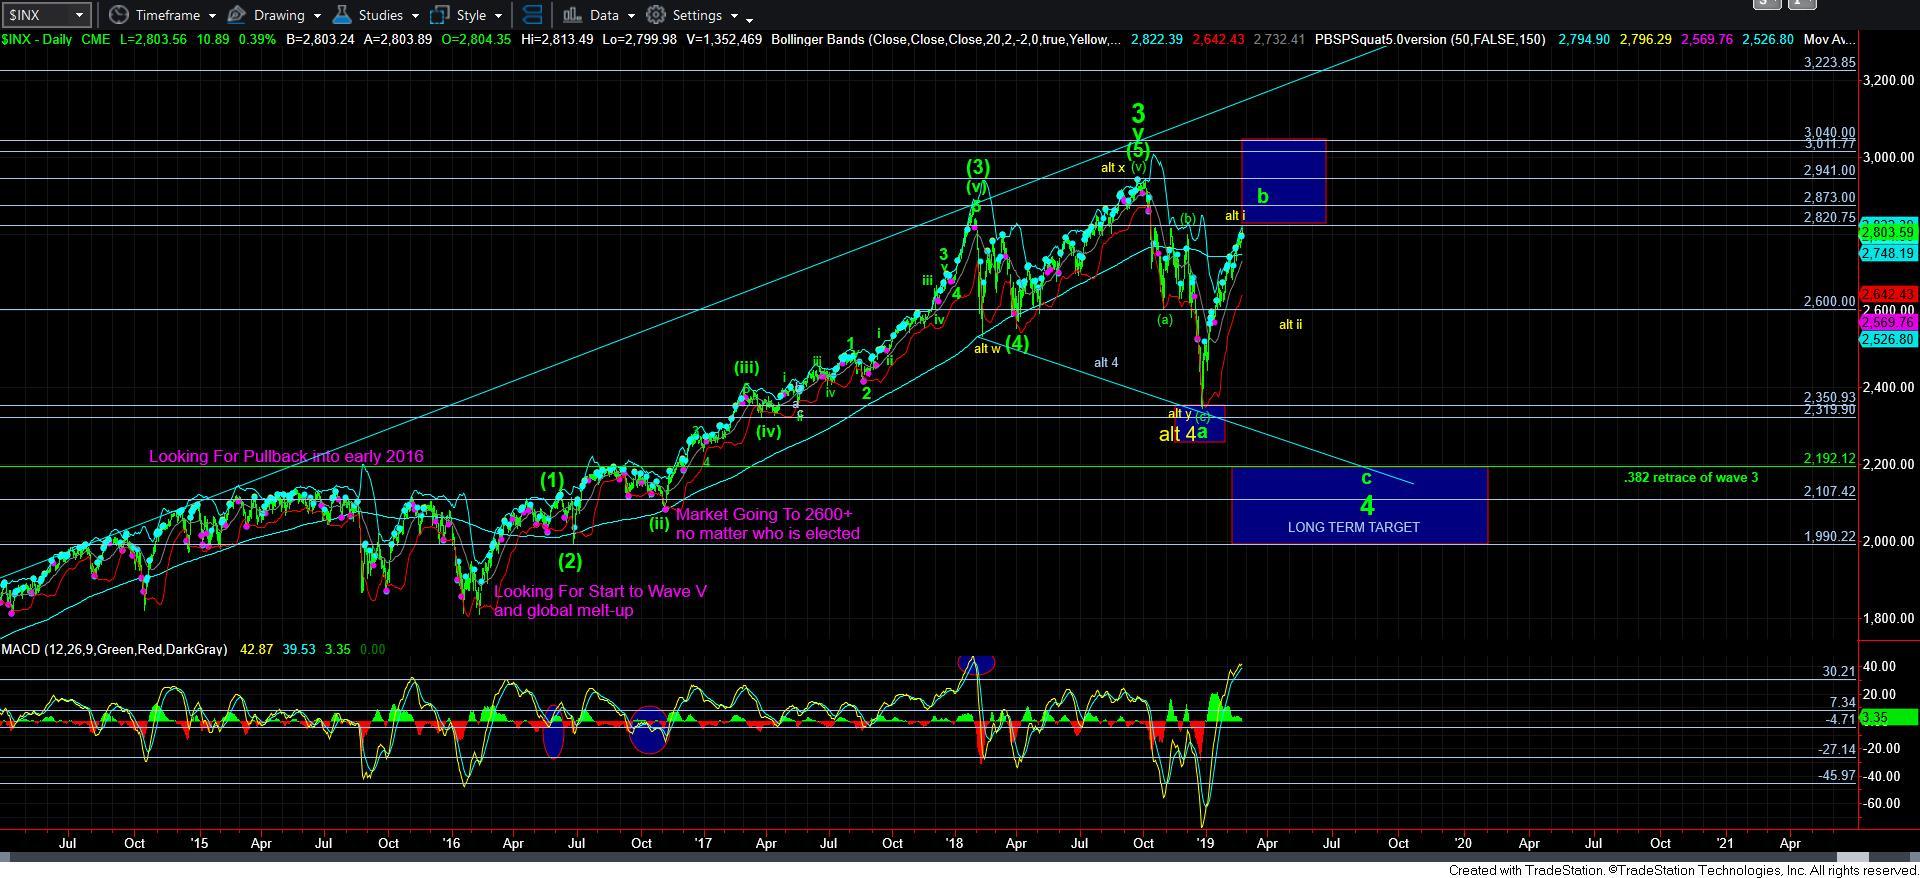
As you know, my expectation has been that wave 5 will attain a minimum target of 3200, with the potential for a blow-off type of top in the 4000/4100SPX region. Based upon the fund flows we have seen over the last few months, I am leaning much more strongly now to the 4000/4100 potential target. So, that means, I am still expecting a sizeable rally in the coming 3-4 years. Even from where we stand today, it is an almost 50% rally potential.
Now, my ideal target for wave 4 was in the 2100-2200 region, and I have explained in nauseating detail in many prior updates how I came about that target from multiple perspectives. That still remains my ideal target for the same reasons.
In order for me to view wave 4 as having completed, as presented as an alternative in yellow now, I have to view that structure as completing a much rarer corrective structure in a W-X-Y structure. Moreover, not only do I have to accept a rarer structure, I have to accept a rarer structure that did not attain its target. For these reasons, this must remain as an alternative UNTIL THE MARKET PROVES OTHERWISE.
So, how can the market prove otherwise?
Well, first, the market is going to have to top around the 2820/30SPX region and then break down. You see, if we top at the 2820/30 region, that is where we would have proportions in the market we normally see in an impulsive move off the lows even though the structure is not suggestive of the fact that this was an impulsive structure. Most specifically, we would be able to “claim” the consolidation I now consider a [b] wave is a 4th wave, with this being a 5th wave rally topping at the 2820/30 region which would then be .618 the size of the initial rally off the lows. Specifically, the standard size for a 5th wave within an impulsive structure tends towards .382-.618 the size of waves 1-3.
So, again, the FIRST sign would be a top in the market in the 2820/30SPX region (which is initially confirmed by a break down below 2770SPX). Second, we MUST see a corrective decline take shape in the coming months down into the 2500-2600SPX region. These are the two things I MUST see in order to even consider this potential.
But, since this is really the only alternative I will have left if the market continues to rally this week, then I am compelled to now present this to you and at least prepare you well before this potential MAY become a reality.
Again, I want to stress this is NOT my primary expectation, but I have to at least outline where it can become a much stronger potential, at least from an objective perspective.
In conclusion, I want to reiterate that as long as we remain over 2796/98SPX, I am looking to continue in the FOMO count in purple, pointing to 2830 for tomorrow to complete wave iii of [v] of 3. However, a break down below that support can either represent us having topped, or the FOMO count will morph into an ending diagonal, for which neither is a high probability long side trade. Remember, the higher we now go, the higher the risks rise.