When Can We Trust The Bulls?
This is probably the question on everyone’s mind, especially after the 3-month battle that has raged between the two competing sides of the market. And, based upon many of the posts I have seen today, there is not a lot of trust out there for the bulls to be able to retain control over the market. Perhaps that may simply add to the wall of worry we may climb in wave (5).
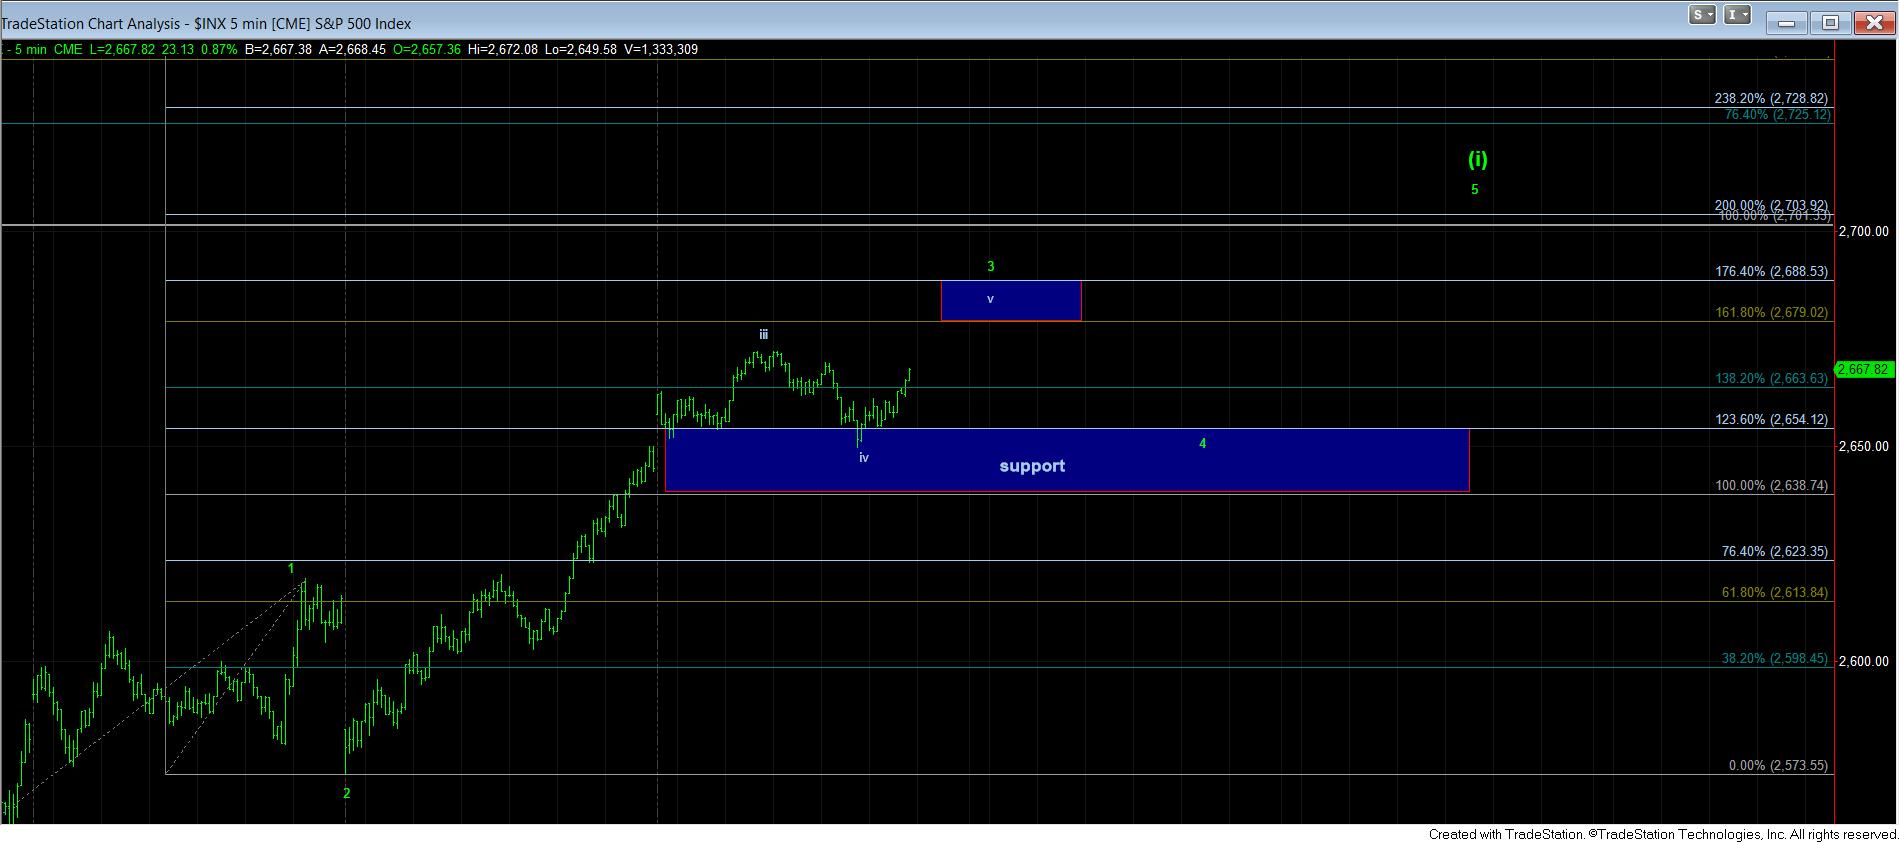
For me, the answer begins with the bulls completing a 5-wave structure forming off a low. The rally off yesterday’s low was certainly off to a great start, but it has not yet completed all 5 waves off that low. In fact, today we seem to be completing only 3 waves off that low. So, we would still need to see a sufficient 4th wave consolidation over the 2640SPX region, and then complete one more rally up towards the 2700 region for a full 5 waves up.
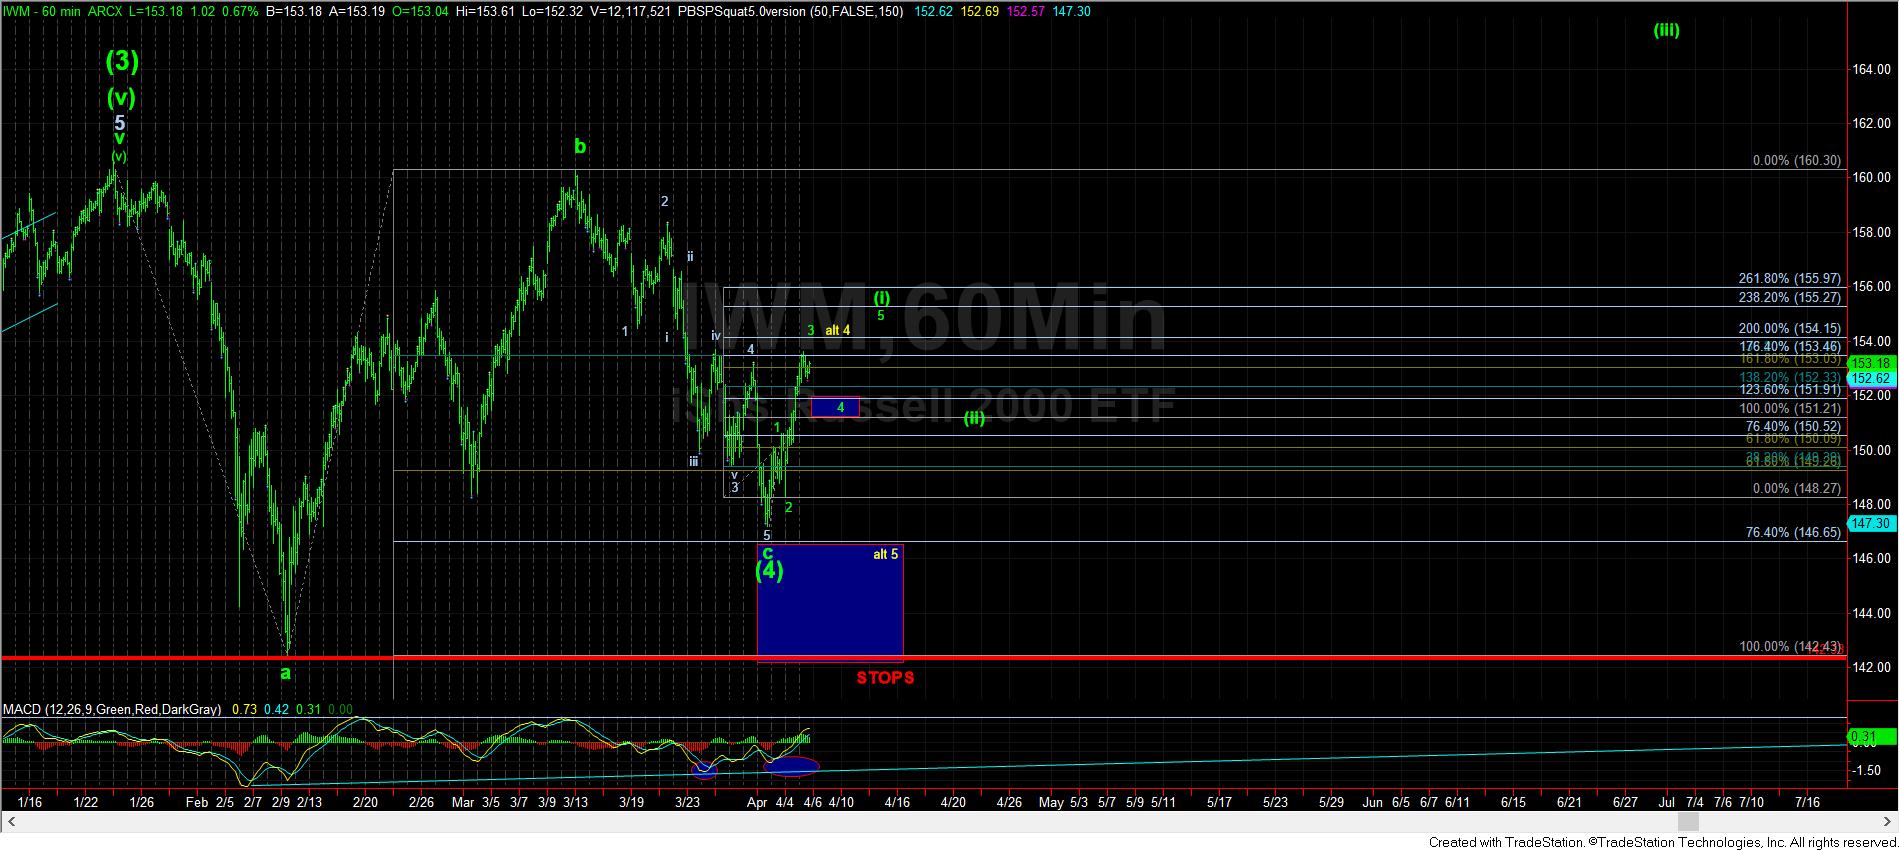
In the IWM, the relevant support level which must hold before 5 waves are completed to the upside resides in the 151.21 region, at the 1.00 extension off the recent lows. Any break down below that level before 5 waves is completed to the upside would argue for this rally only being corrective in nature.
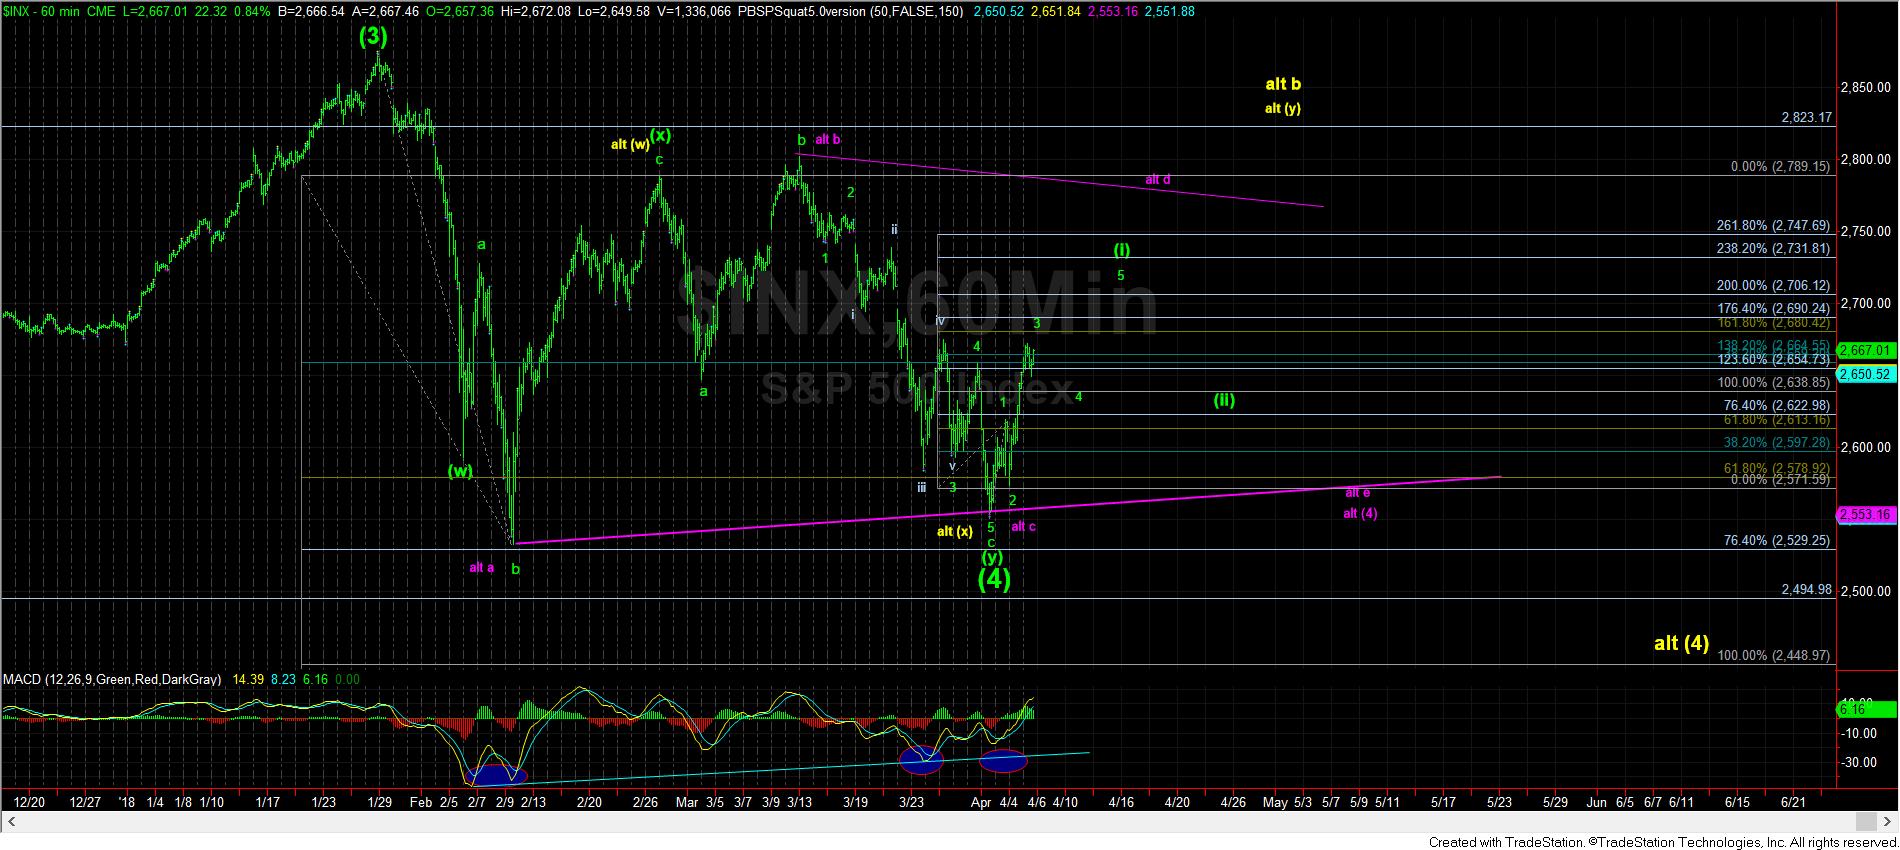
Until we see a more bullish set up after 5 waves off the lows, the bears can certainly come back to life, despite how high this rally has taken us. In fact, as I show in my attached IWM chart, this rally can still present as a 4th wave rally, if we top out as a 3-wave rally, and then see an impulsive drop below 2640SPX, with follow through below 2620SPX (and a corresponding impulsive break of 151.21 in IWM). And, if such a decline is not impulsive, and is only corrective, then it will start increasing the probabilities for the alternative counts presented on my 60-minute SPX chart, both still needing higher levels to be seen, whether in the d-wave of the triangle, or the alternative flat pattern in the yellow.
Allow me to explain that a bit further. If the market has its eyes still on a lower low, then the only way to reasonably account for a lower low immediately would be that this rally is a 4th wave rally in this “impulsive” c-wave structure to the downside. However, if the break below support (151.21IWM and 2638SPX) will take a corrective shape, then it likely means we are setting up an a-b-c structure off the recent lows, which places us either in the triangle in purple or the bigger b-wave flat in yellow, both presented on the 60-minute SPX chart.
Ultimately, it means that the bulls now have the ball and can give us much more confidence if they complete 5 waves up off the recent lows. A failure to do so will then have us analyzing the decline to determine if we are going straight down to a lower low, or if this correction can push out another month or two in one of the alternatives presented on my 60-minute SPX chart. Again, the lines have been drawn.