What's Next For the SPX After Hitting The First Target?
 By
By
After seeing a fairly sharp rally off of the lows that were struck on Monday and hitting the short-term target levels that Avi had laid out over the past few days, we saw the SPX take a bit of a pause today. This pause occurred very near to the 100 extension of the initial move up off of the lows, which is typically an early warning sign that the market may be ready to see at least a near-term pullback from those levels.
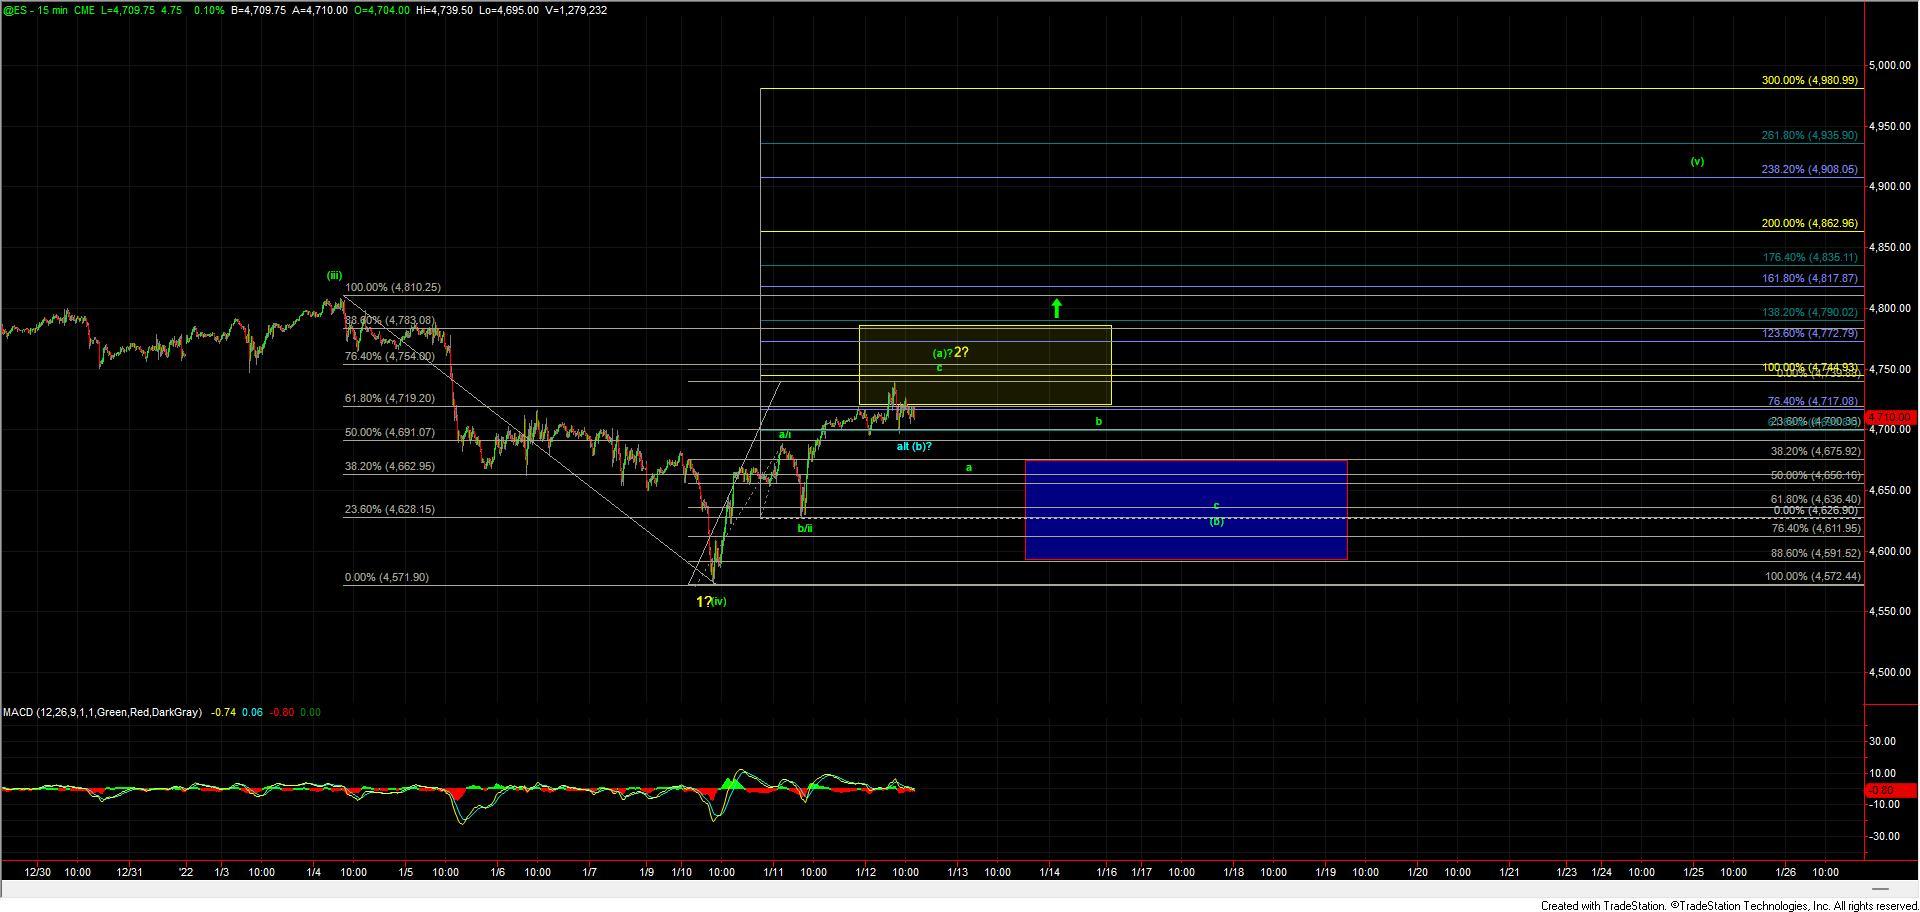
So far and as we approach the end of trading for the day, we have yet to see much of a pullback but rather what I would consider a high-level consolidation after hitting those levels. While this pause in the push higher is certainly opening the door for the SPX and ES to have formed a local top in the wave (a) per the green count as shown on the ES chart, until we see a deeper pullback I still can't fully rule out that this may want to extend directly higher before finding that local top.
From a price perspective, I would want to see this drop back below the 4691 level to give us that initial signal that we have begun the green wave (b) down. Should we see a direct break back up over the 4744 level followed by a push through the 4754 level, then it would open the door for this wave c of (a) to extend higher up towards the 4790-4835 zone before finding a local top.
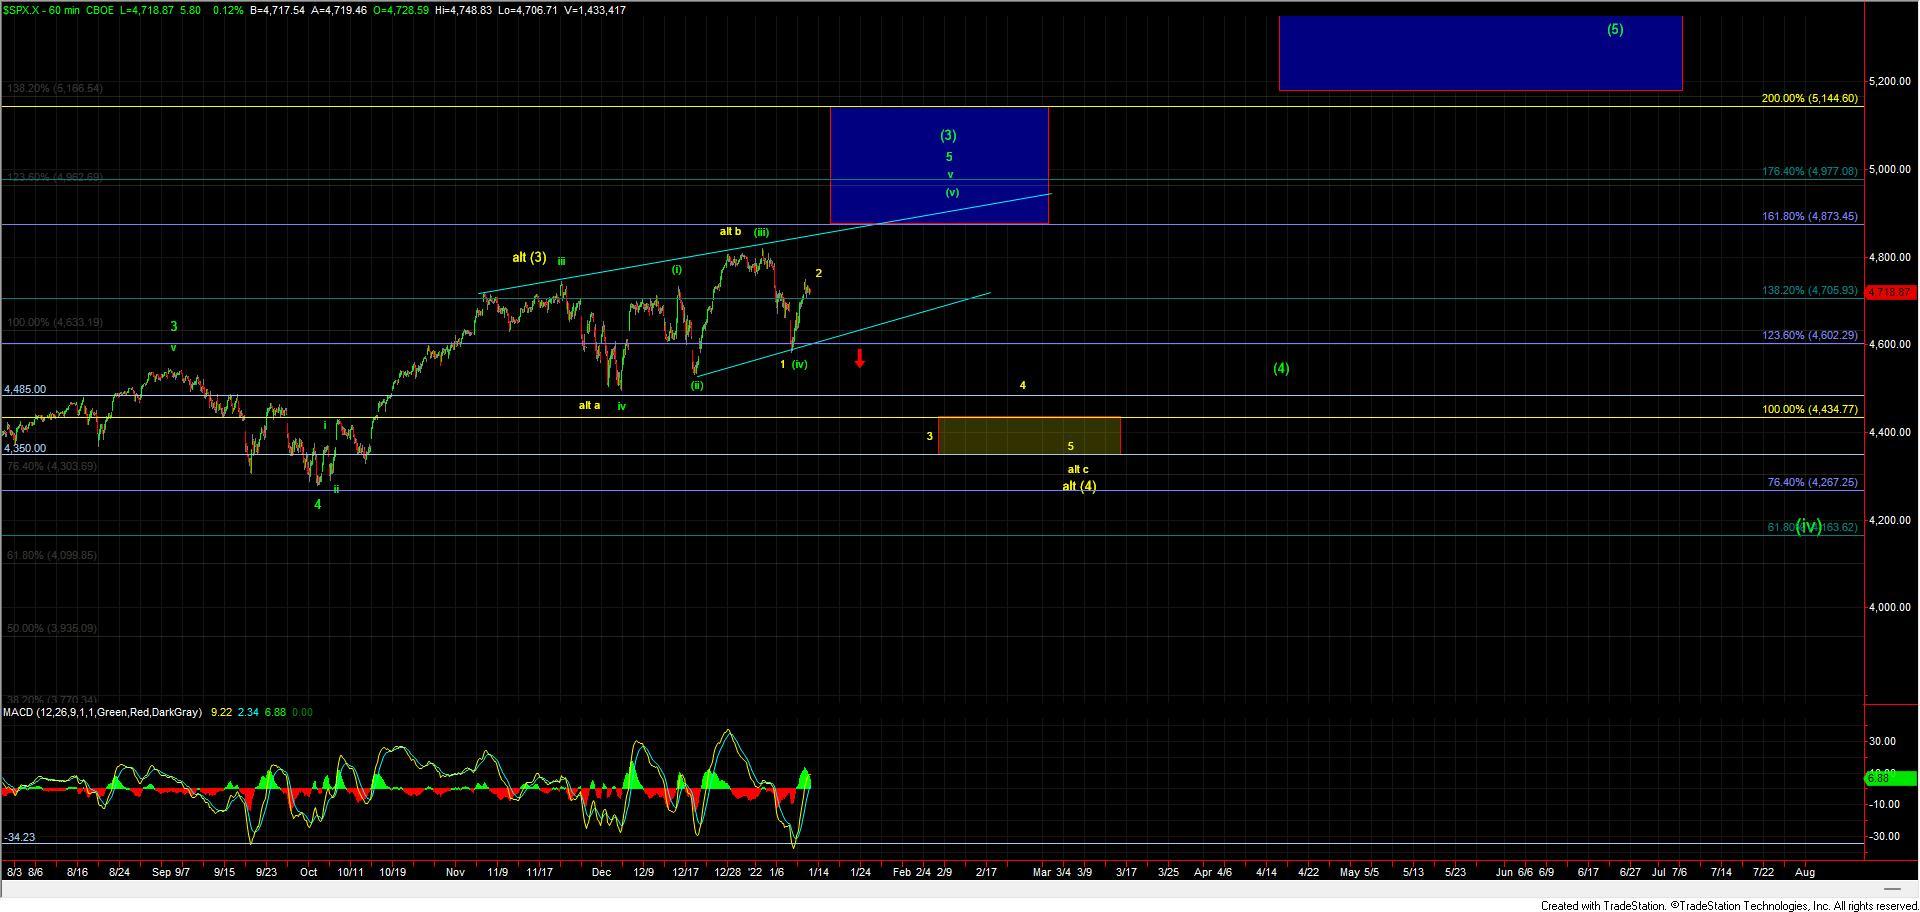
In either case, as long as the next pullback takes a corrective three wave structure to the downside, then the green count will remain very much the primary path forward and I will continue to look higher for this wave (v) to give you another higher high to finish off the pattern as laid out on the SPX chart.
Should, however, we see a full five down off of the next local top (whether that occurs from here or from an extension higher), then it would open the door for the yellow wave 3 to have begun. We would still need to see a push under the 4591 level followed by a break of the 4571 low to give us further confirmation of the yellow count. However, if we do see a full five down off of the highs, it certainly would be an early warning sign that the yellow path may be playing out.
Although the price action over the next several weeks is likely going to be quite sloppy and difficult to trade, so far today this has followed the expected path fairly well. Furthermore, with what is still an incomplete upside pattern, I am still going to give the benefit of the doubt to the green path, which still needs to resolve higher to finish off the larger degree pattern.
So, as long as this continues to remain over the support zone noted above, the near-term pressure will continue to remain up. We are, however, closing in on a range, and it would be prudent to exercise caution as the market works its way higher towards finding a more significant top in the wave (3) as laid out on the SPX chart.