What Needs To Happen To See A Pullback?
Yes, the market has enough waves in place to complete all of wave iii off the August lows. But, that does not mean the market has completed wave iii.
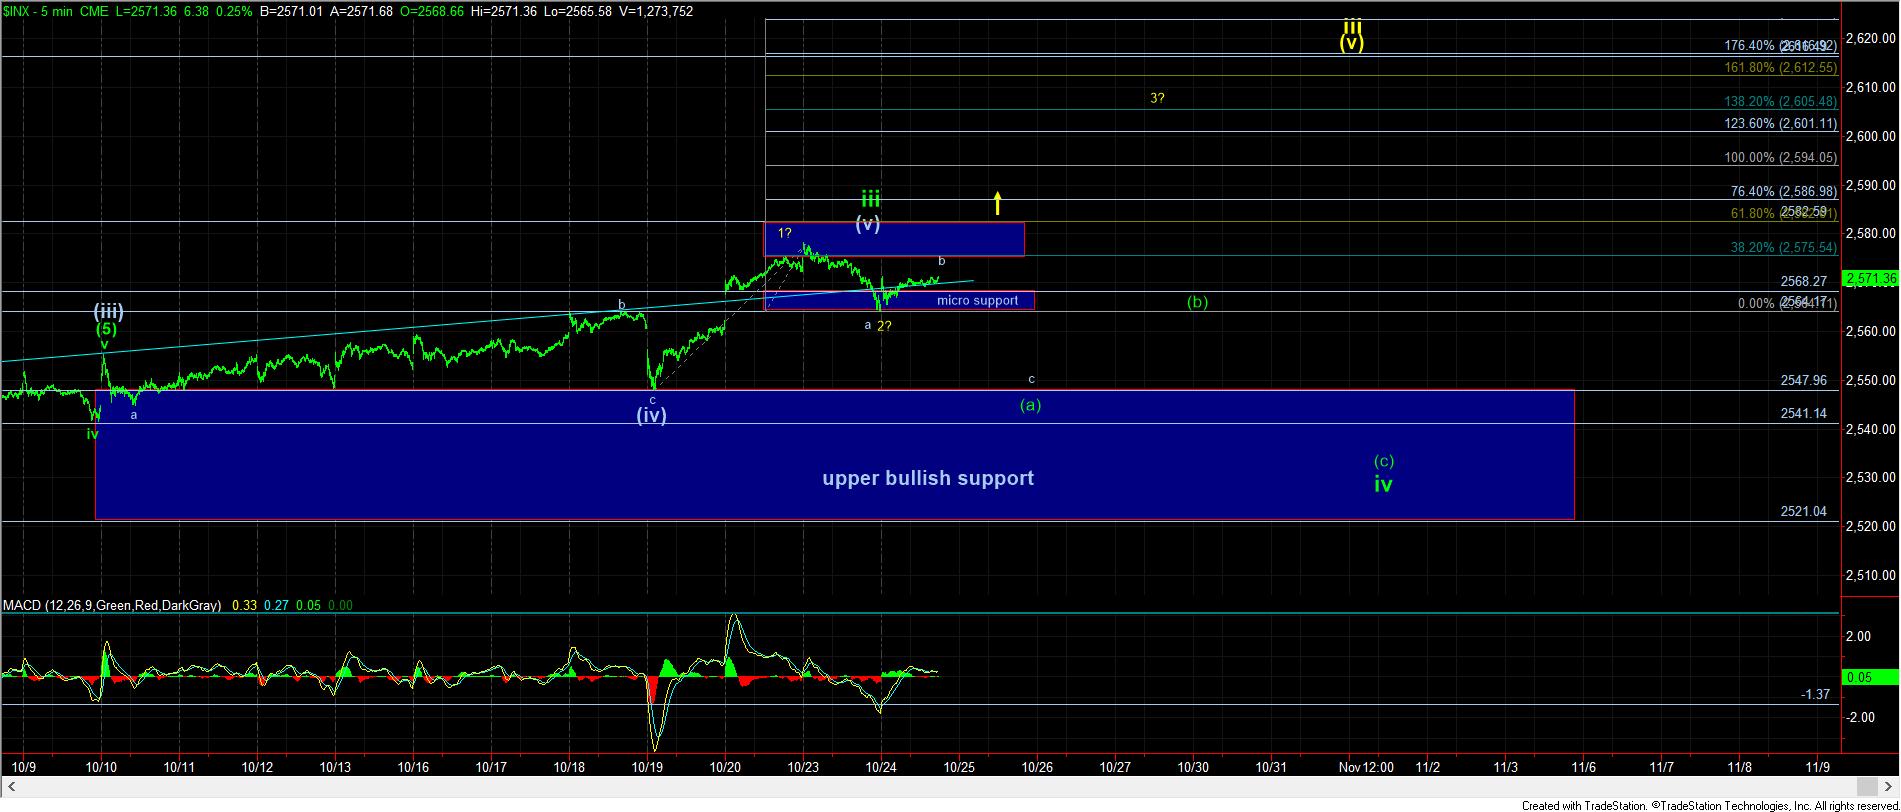
Yesterday, the market tested our micro support region, and, today, rallied off that support. But, I cannot say that the rally in the SPX/ES has been convincingly bullish today. Rather, it counts best as a corrective rally, which is why I have the a-b-c structure on my 5-minute chart. Under ordinary circumstances, this is the count I would strongly adopt.
But, since the market has not broken even micro support, and we are still in a bull market which likely has higher levels to strike before the bigger pullback in wave (4) will be seen in 2018, we have to be VERY cognizant of potential further extensions that the market may try to hit sooner rather than later.
So, I am going to lay out the market for you as I see it right now.
As long as we can hold below the 2574/75SPX resistance level, I can reasonably view this move up as a b-wave, and having started green wave iv. BUT, we will need some amount of confirmation with a break down below our micro support region.
However, if the market is able to move through the 2575SPX region, then the 2583SPX region will be the deciding region between wave iii topping or extending over 2600SPX. As I have mentioned, wave (v) would be equal to .618 the size of wave (i) in the 2583SPX region. Moreover, if the bottom we just struck at micro support is actually a 4th wave in wave (v) of iii, a 5th wave is often equal to .618 the size of waves 1-3. That would also give us a 2583SPX region target for a potential top to wave (v) of iii.
Lastly, if the market is able to break out strongly through 2583SPX, it opens the door to the yellow extension noted on the 5 minute chart, which would then have the market targeting the 2618SPX region for wave (v) of iii.
I think this is a good time to remind you that Elliott Wave analysis is not meant to tell you what the market MUST CERTAINLY do. Rather, it is used to identify what the potential is in the market, identify potential turning points, and provide confirmation levels for those turning points. In other words, it provides you with probabilities as to what the market can do in its current stance. And, I have tried to provide you a guide above as to how I see the market within this region, and what the guideposts are to assist you along the way.
Lastly, please continue to keep in mind that this is a bull market, and I have no high probability pattern which suggests a major top has yet been struck. In fact, even if we do pullback in wave iv from here, it still points to at least one more rally in wave v towards the 2611 region before we can even consider having enough waves in place to begin to look for signs that wave (4) into 2018 has begun.