What Is The Path Higher?
With the market holding support and “bouncing” today, the question with which we will now grapple is where we are heading in this corrective rally?
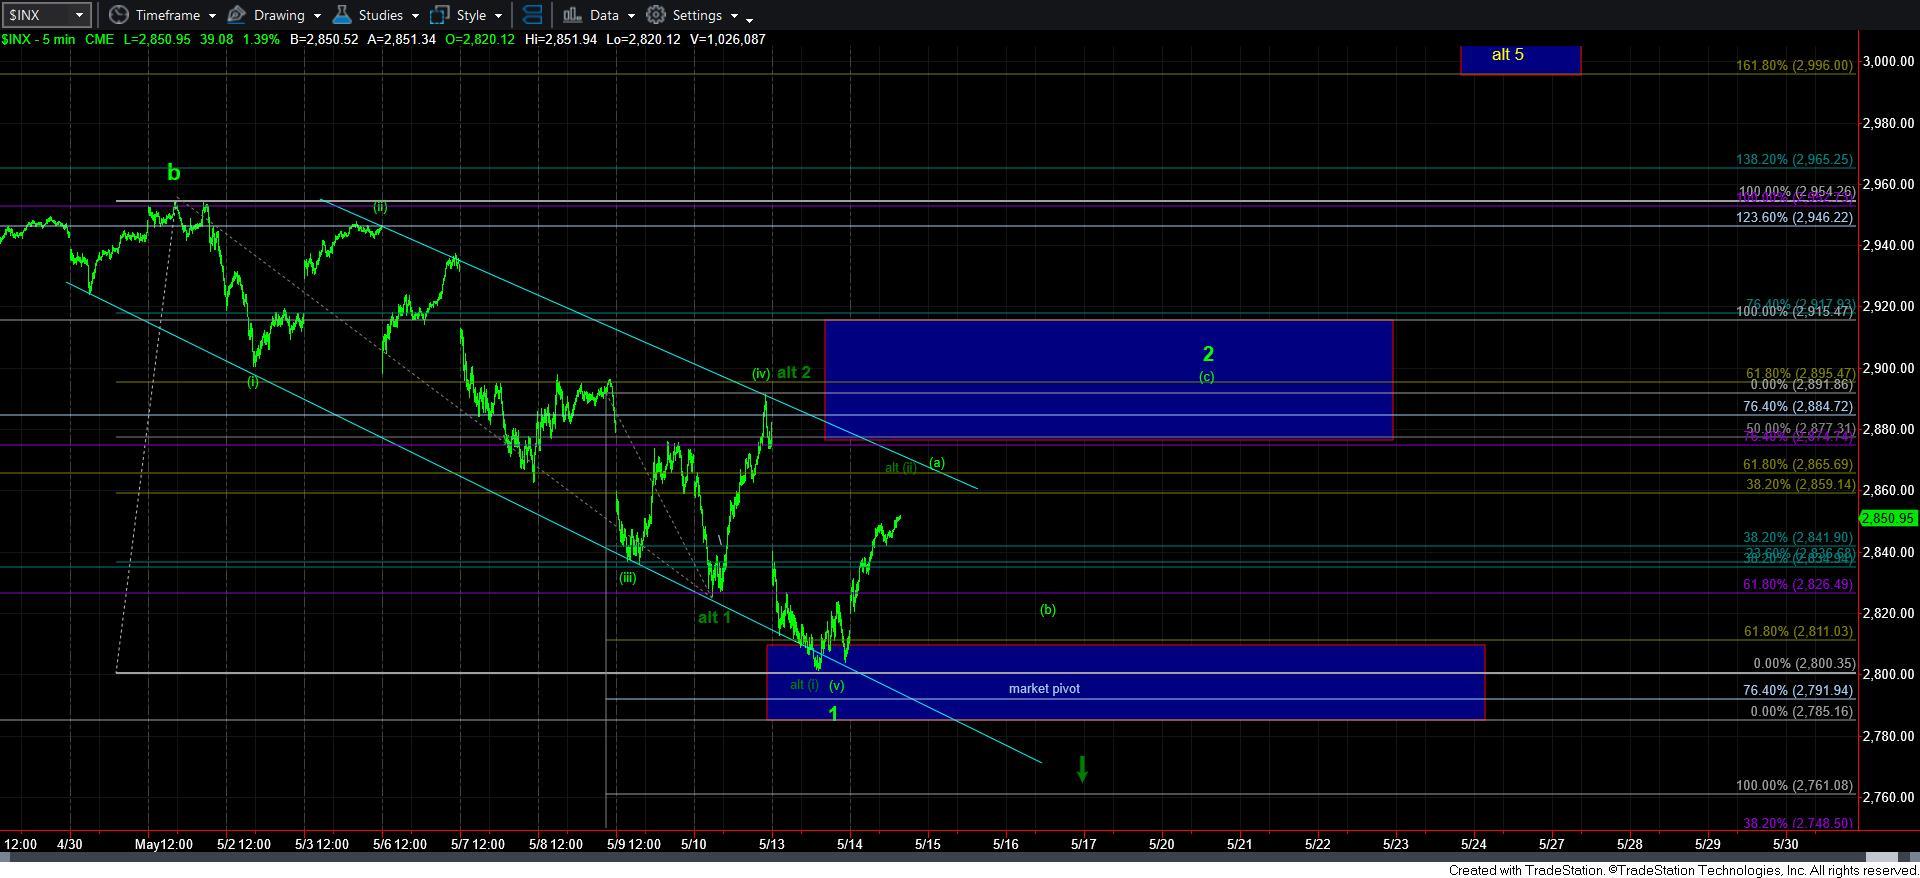
As I noted before, ideally, we are in a wave 2 corrective rally. That takes the general shape of the [a][b][c] structure I have outlined on the 5 minute chart in light green.
As for right now, our larger general target for wave 2 is in the 2875-2920SPX region, where the .500-.764 retracement of wave 1 down resides. But, we will need to be able to narrow that down, so let me explain how I do it.
First, I want to repost what I noted in an alert earlier today:
“The ideal target for a wave 2 or b-wave is usually the .618 retracement of the prior a/1 wave. That means the corrective move in the 2/b will be an a-b-c structure. Within that a-b-c structure, the a-wave often targets the .382 retracement . . . in our case, that is where the downtrend line resides, so that would be a logical target for the [a] wave of this wave 2.”
Second, once this initial rally completes, we often see a retracement in a [b] wave, which targets the .382-.618 retracement of the [a] wave rally.
Third, it is at the point in time - when the [b] wave bottoms - that we can then identify the [c] wave target a bit better. You see, a 2nd wave retracement will often see an [a]=[c] relationship in its corrective rally. Sometimes, it extends to the [c]=1.382*[a] region.
So, once the [b] wave bottoms, we can then identify where the [a]=[c] and [c]=1.382*[a] extensions reside. Moreover, we also want to note if any of these extensions overlap with the .500, .618 or .764 retracement of wave 1 down. And, lastly, once waves 1 and 2 of the [c] wave are in place, we then want to see where the 2.00 extension of that 1-2 structure points. Ideally, that 2.00 extension will overlap with at least one of the Fib levels calculated above. That is the type of confluence that we look for when trying to narrow in on a wave 2 target. If we have 3 calculations pointing to the same level, that becomes a very high probability target for the wave 2 top.
Lastly, I also want to highlight the more immediate bearish alternative potential. As you can see, I have still retained the dark green count, which would suggest we are already in a 1-2, [i]-[ii] to the downside. As long as we remain over 2780/85SPX, I will only view this as an alternative count. Should we break below yesterday’s low, that is a strong warning about any further immediate bullish potential. And, should we break the 2780/85 support, and follow through below 2760, this alternative count will become my primary, which will have me looking for a potential waterfall-type event, similar to what we experienced in the fall of 2018, in January of 2016, in August of 2015, and in August of 2011. And, I will follow the price action down while moving our resistance regions down the lower we go.