What Is Considered A “Break-Down?”
 By
Avi Gilburt
By
Avi Gilburt
When we provide analysis, we often discuss that a “break-down” will open the door to a larger decline. And, sometimes we see the market break that cited support, only to come back again. So, I am often asked how can we determine if something is truly broken?
The reason I am addressing this now is that we had two perfect examples of how the market supposedly “broke” the cited 7625ES level, but we did not get the waterfall decline. So, I thought this a perfect time to discuss it, especially since the market showed us two ways it “breaks” a level but does not really break that level.
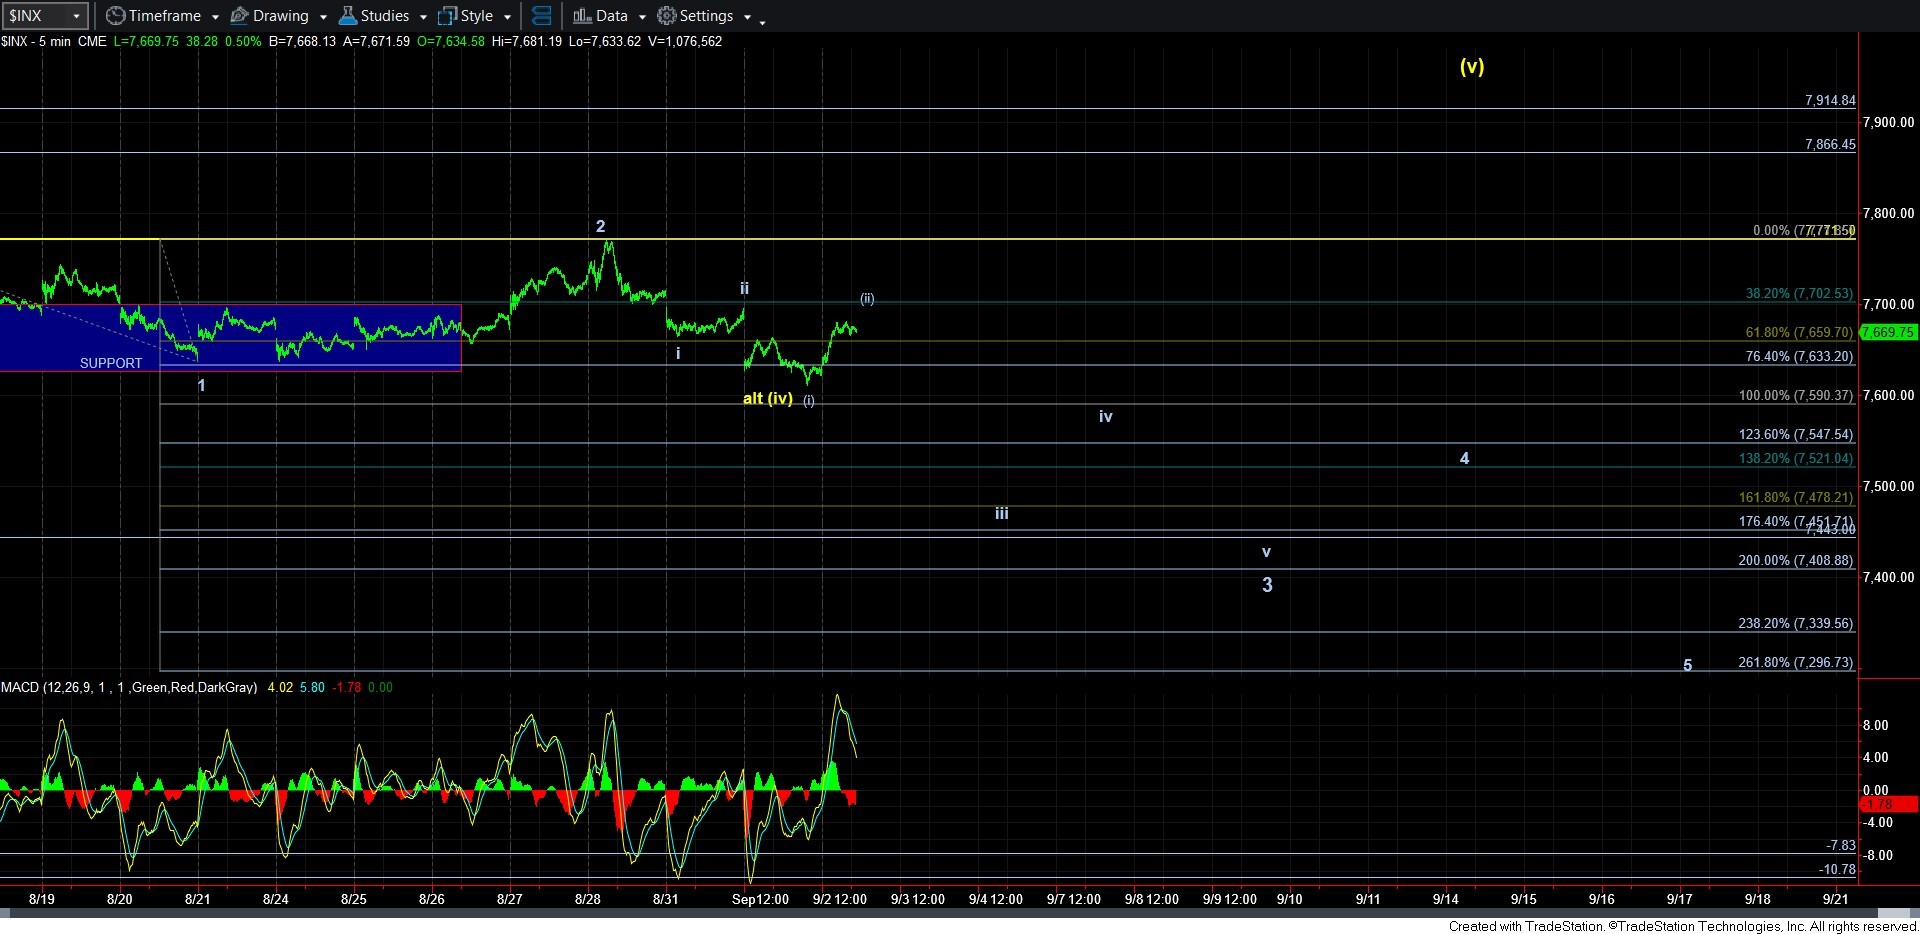
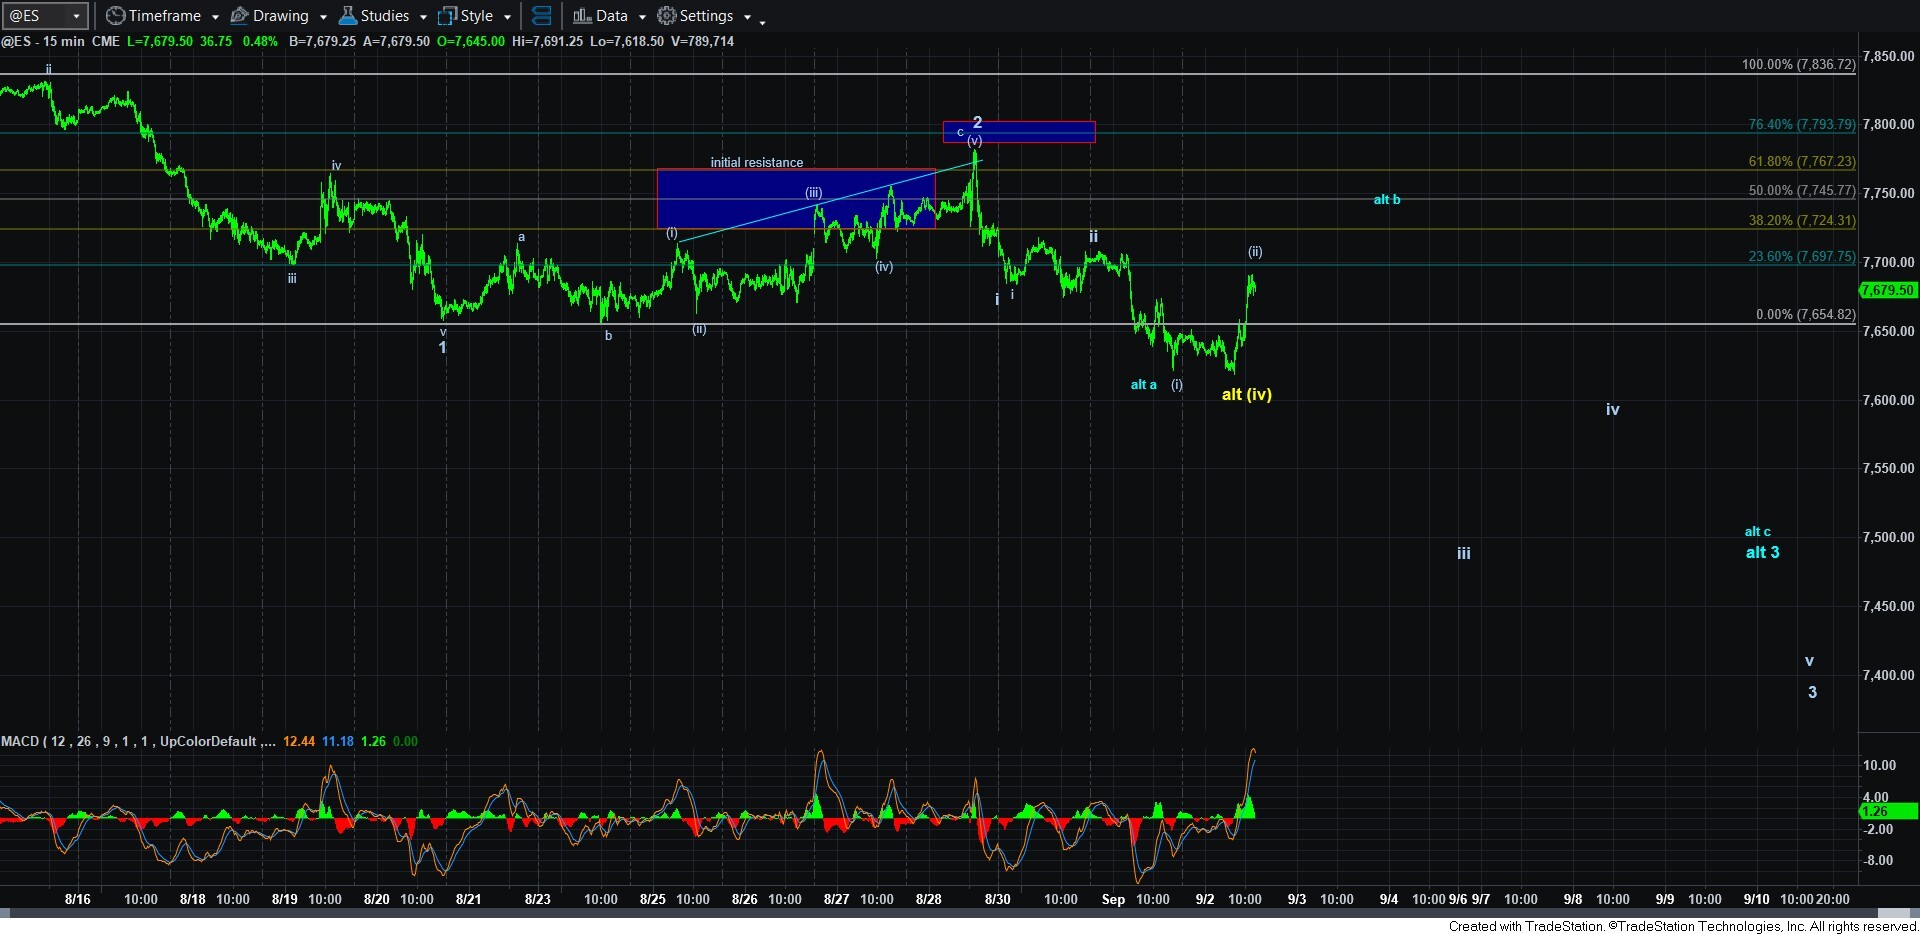
The first was seen yesterday after my update was posted. We saw the market spike the 7625ES level, only to spike right back up over it. So we can clearly see that a spike and reversal of a support level is not considered what we call a “sustained break.”
The second was seen in the overnight action. ES seemingly dipped just below that level in the overnight low-volume action, and simply hovered just around it for some time before it came back up above it just before the market opened. Clearly, this is also not a “sustained break” of the cited support.
So, when we seek a break of support, we are looking for something that sustained that break of support and not a spike and reversal and not a consolidation just around or below it and then a reversal back up over it. These are what we consider false break downs, which clearly add to the challenges of trading.
I want to also take the opportunity to distinguish this from an "invalidation." And, invalidation is when the market moves to a point that completely invalidates a pattern, and this is different than a break down or false break down. For example, if the market - during a supposed wave 2 - breaks below the start of a wave 1, that break invalidates that prior move as a wave 1. But, it does not mean that it is a break down that opens the door to a major move in the opposite direction. While it may do so depending on the structure of the market as it invalidates the prior EW 1-2 structure, that is not the meaning of when a market invalidates a 1-2 structure.
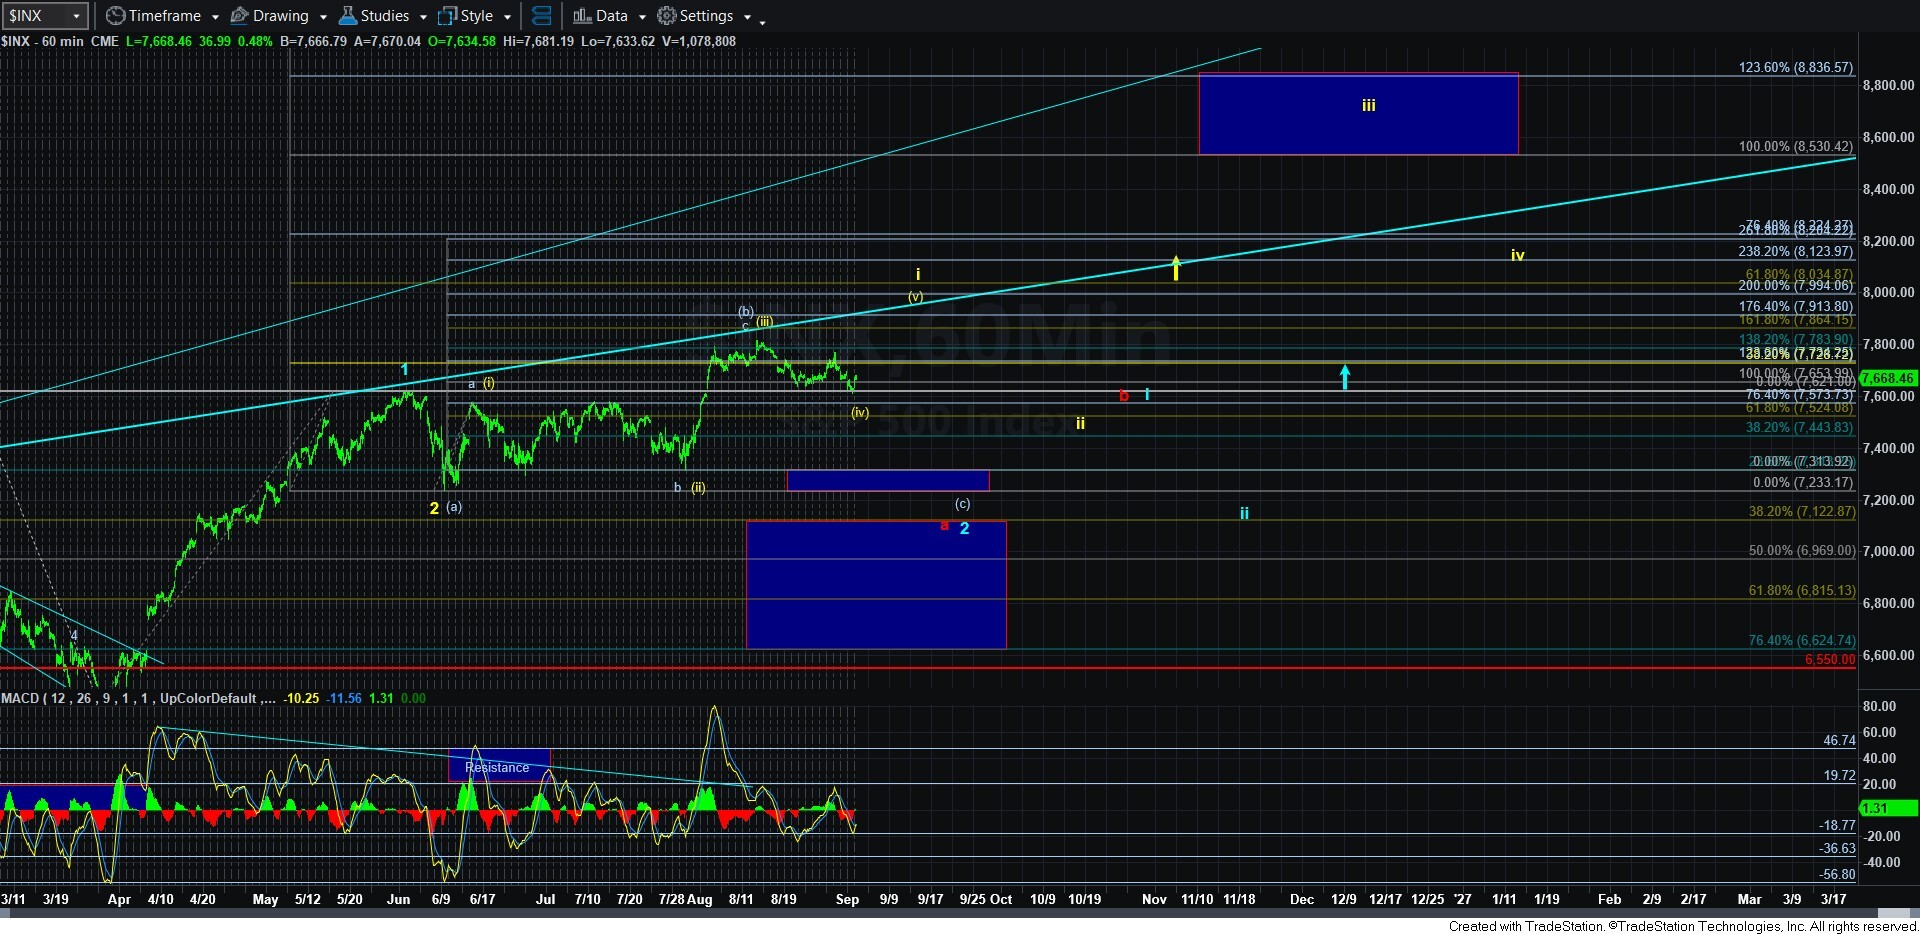
Now, without the sustained break of support, the market is, in effect, still holding that support. And, while the structure still allows for a series of 1’s and 2’s to still be pointing us to that potential waterfall set up in the heart of a 3rd wave decline, if we break back over the wave ii high, then it would cause us to move into the potential that the (c) wave decline is taking shape as an ending diagonal, as outlined in blue on the ES chart. Moreover, it also suggests that the (c) wave may not attain the ideal target of the top of the support box on the 60-minute chart in the 7100SPX region, but we may complete this (c) wave in the 7300-7400SPX region.
Of course, we still have to keep our eyes on the alternative in yellow, but, for now, that is not a strong probability just yet as we do not have 5 waves up off the overnight low.