What Is A “Set Up?”
The way I define a set up is when the market “sets up” in a manner that suggests a high probability pattern, assuming all parameters are met. And, we have been tracking a set up for a 5-wave c-wave decline in the SPX for some time now.
So, allow me to analyze the structure as it currently stands.
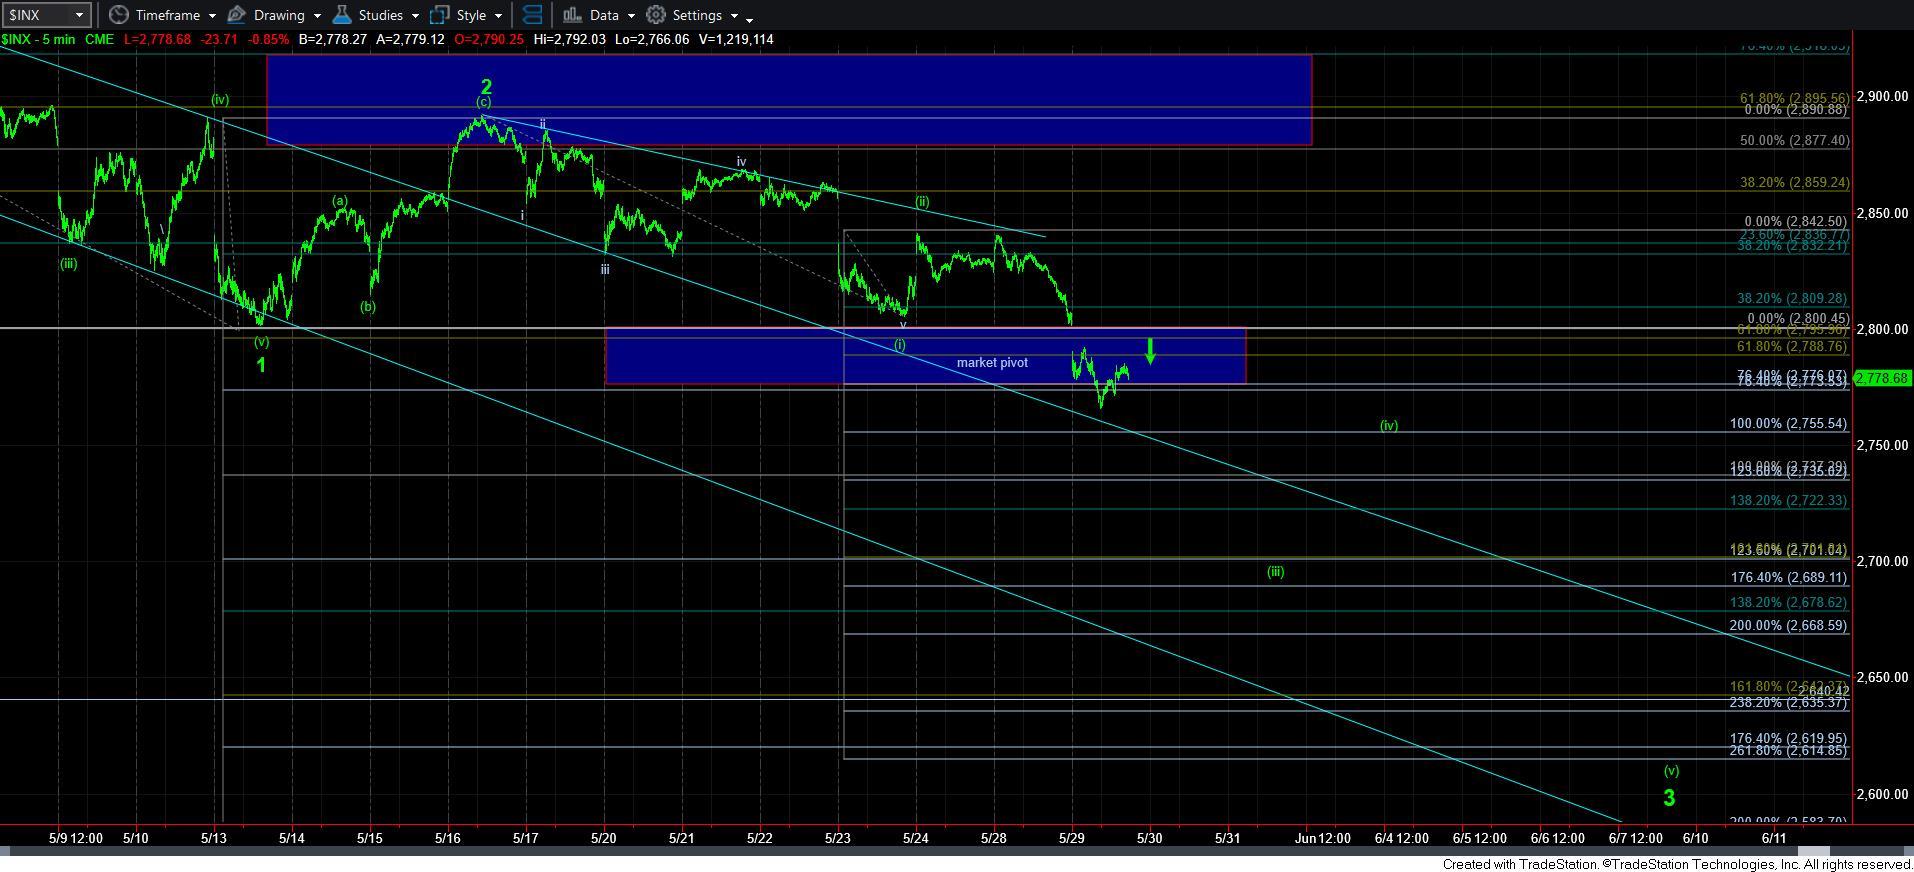
Initially, the market dropped down off the May 1st high in what counts relatively well as 5 waves. We have that labeled as wave 1 down. Thereafter, we experienced a clearly corrective rally, which we labeled as wave 2. Thereafter, the market declined in a bit of an amorphous overlapping downside structure. While I classify it as a wave [i] of wave 3 down, the only way that it can be counted as such is as a leading diagonal. And, I have outlined my apprehension about relying on leading diagonals many times before, so I will not reiterate that again.
Since the market “bounced” off the lows I have counted as wave [i] down in a corrective rally, I have that counted as wave [ii], but it is notably small. The market has now dropped since that time, and the drop also looks like 5-wave structures. So, this means that my primary expectation remains to the downside.
From a Fibonacci Pinball structure, we have also been dropping appropriately. After waves 1 and 2 developed, wave [i] of 3 approached the .618 extension of waves 1 and 2, which is the typical target for wave [i] of 3. But, as I noted, the wave [ii] thereafter was relatively small.
Since then, we have dropped just beyond the .764 extension of waves 1 and 2, which normally means we have begun the wave [iii] of 3 if this is a standard impulsive structure. And, when we move beyond the .764 extension, it means that this drop is now too large (based upon our Fibonacci Pinball standards) to be a bigger wave [i] of 3. That means that the drop we experienced today “should” be part of wave [iii] of 3 down.
Normally, when we break down, the market drops down to at least the 1.00 extension for wave [iii] of 3, which, in our case, is in the 2737SPX region. However, based upon the larger degree structure, I expect that we “should” blow through that rather easily and point us down to at least the 1.236 extension in the 2700 region.
Today, the market was only able to spike down and then reverse at the 2770SPX region which I noted over the weekend was the region we needed to solidly break for confirmation of the 3rd wave down. And, as I am writing this, we are still bouncing.
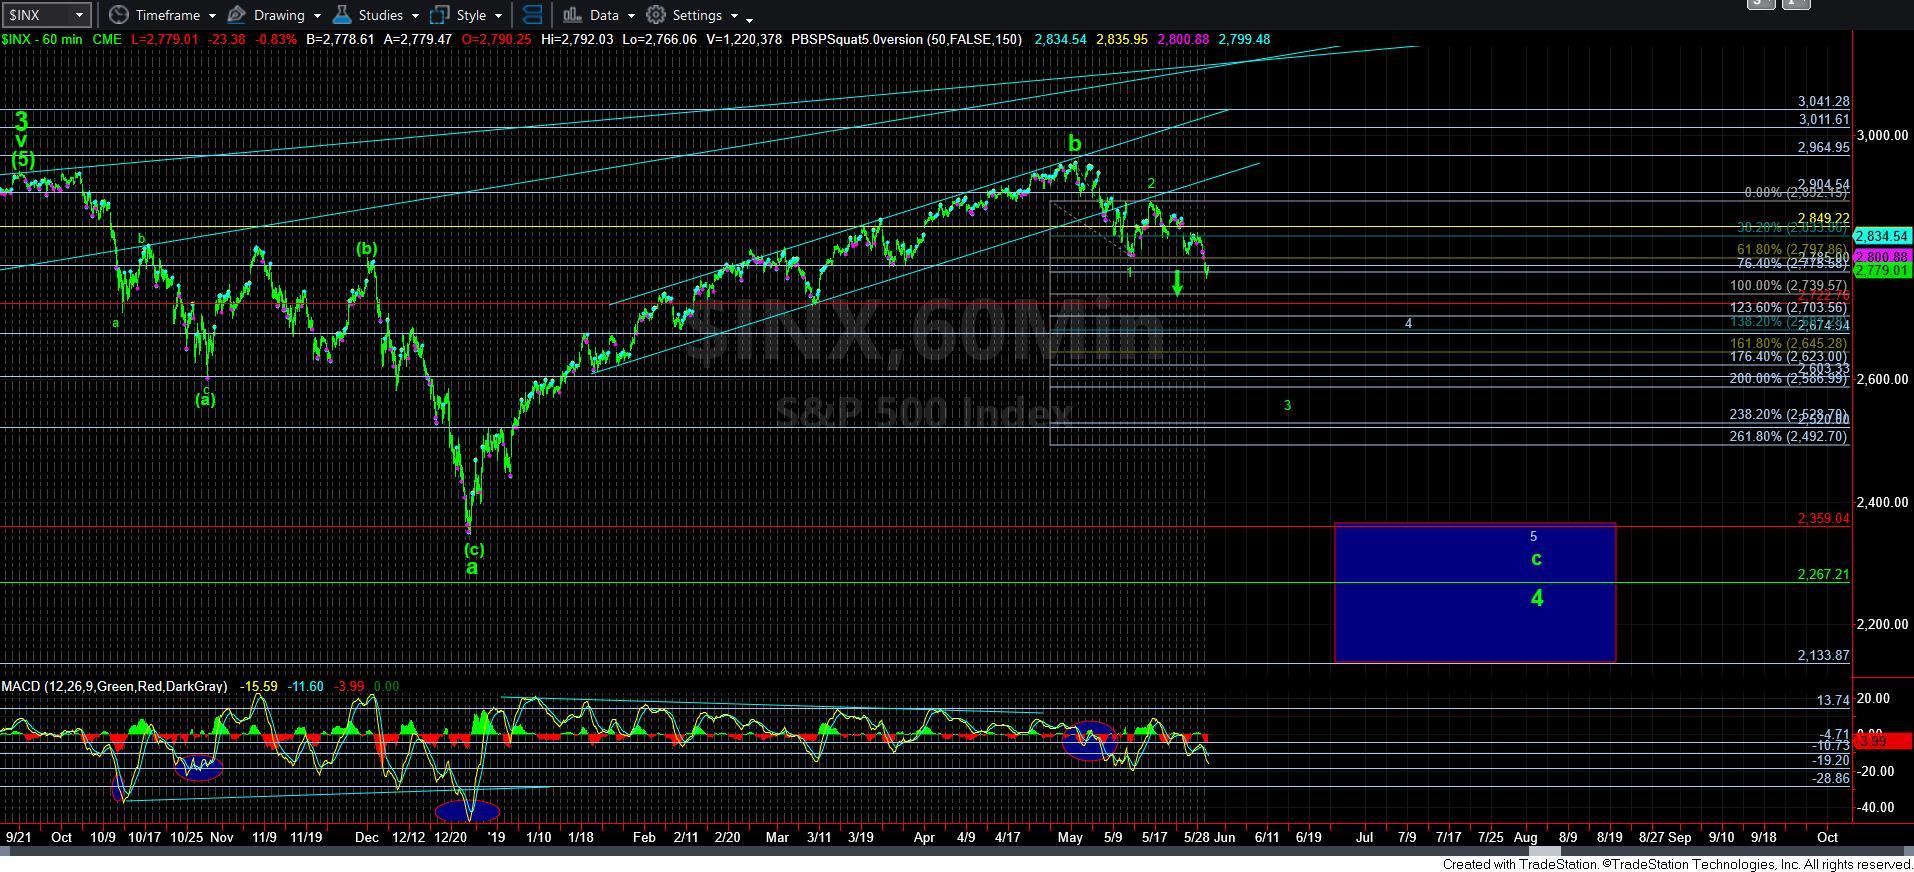
So, if the market is truly in the heart of a 3rd wave down, I would prefer to see us remain below 2790/2800SPX region (from which we just broke down), and then continue lower into tomorrow. In fact, I want to us to continue down strongly into tomorrow. If so, then we are likely within the 3rd wave, and I think it points us down towards the 2700 region rather quickly, followed by a bounce in wave [iv] of 3, on our way towards the 2600 region (and even potentially lower), as outlined on the 60-minute and 5-minute charts.
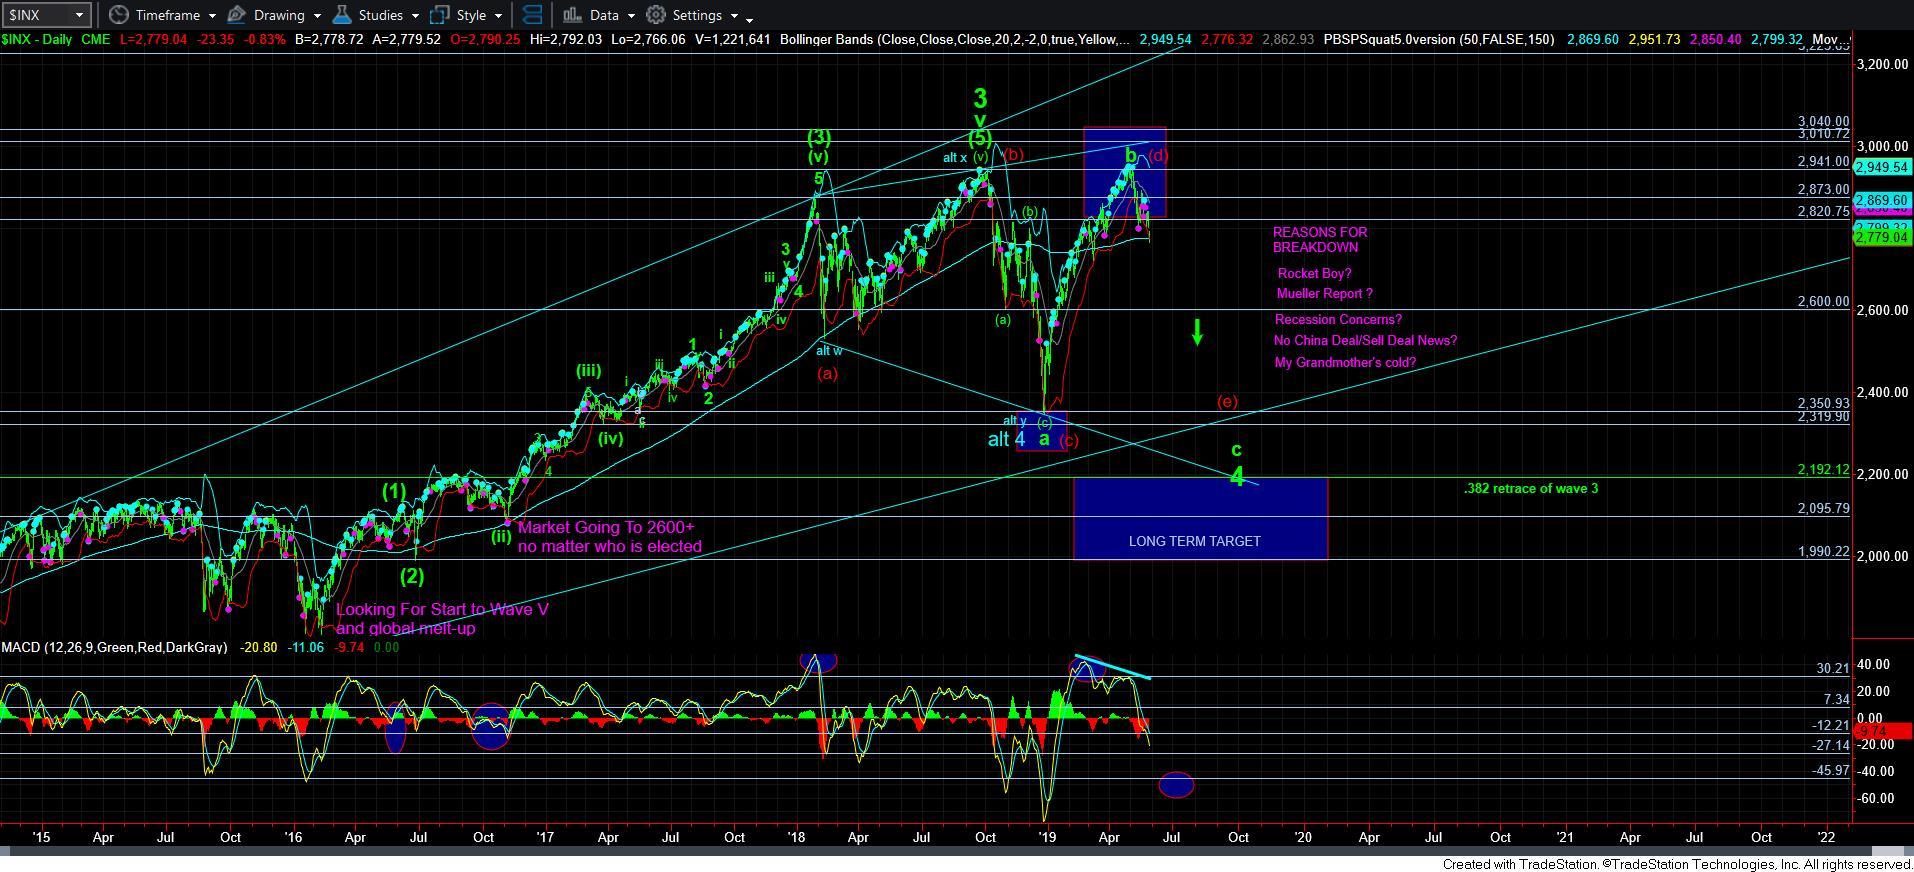
Alternatively, when the market has a set up in place, and refuses to follow through on that set up, it is often an initial signal that it has something else in mind. And, that something else may be a very complex structure, which still likely points to much lower levels. As I highlighted in the past, some potentials for that complex structure could be an a-b-c structure down in the [e] wave of the red triangle count outlined in the daily chart, as well as other possibilities.
But, before we even discuss alternative ways in which we head to lower levels in the coming months, we still need to give the market an opportunity to follow through on the current structure. And, if it does, tomorrow will be a very red day.
The last point I want to make is that I want to remind everyone we deal in probabilities, and not certainties. While the market has a “set up” to take us much lower and rather quickly, we must listen to the price action as that will make it clear whether this is the path we are following. And, since many of our members got into their shorts at much higher levels as we were tracking this set up, we still have room to allow the market to play out regarding how it will take us lower. But, in the most immediate sense, I would rather see it drop strongly from here to continue in a 5-wave downside structure.
And, as I warned in my writings and videos, should the market be unable to respect the Fib Pinball resistances we note on the way down, we have to recognize early that it will morph into something else, and treat it accordingly. Remember, HOPE is the worst four letter word in a trader’s vocabulary.