What Does Topping Look Like?
With the market taking the direct path higher today, allow me to explain what I am looking for to signal a top to a wave 2 retracement.
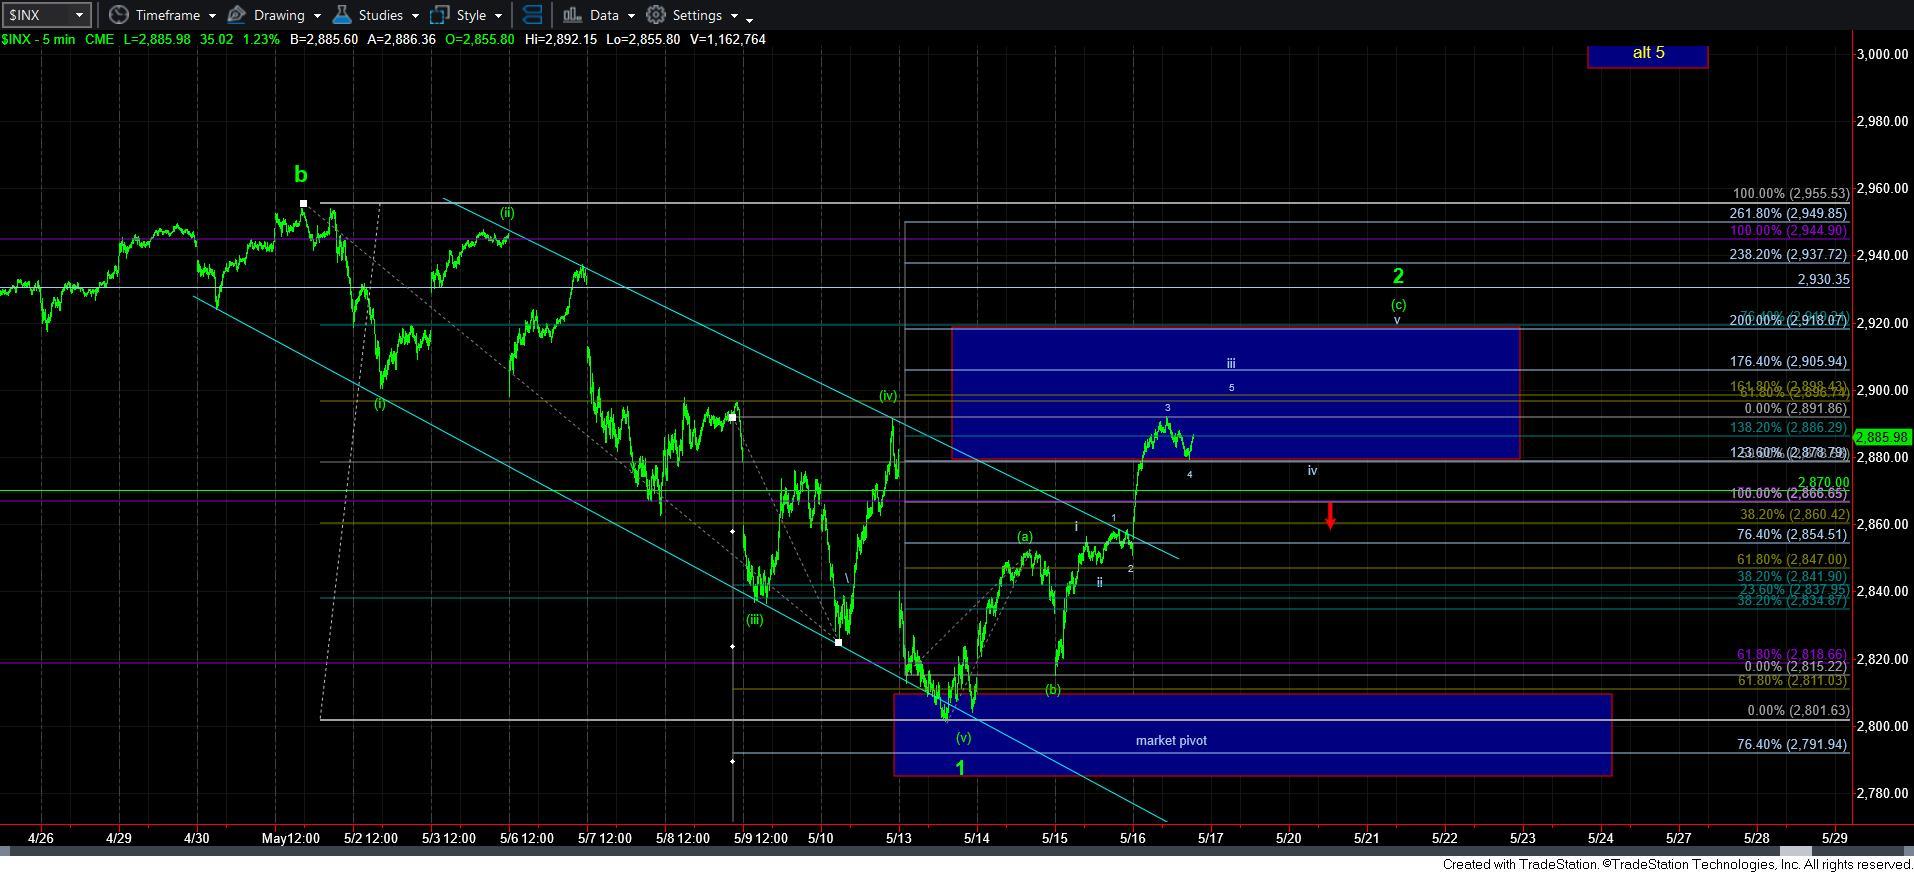
With the rally today, the structure suggests that we are in the wave iii of the [c] wave of 2. But, within that wave iii, the pullback we are experiencing as I am writing this update suggests it is wave 4 within that wave iii. And, as long as the market holds the 2875SPX support, then that is how I am counting this rally.
This means that I am expecting a higher high to complete wave 5 of iii, followed by a day or two long wave iv. You see, wave ii in this structure for the [c] wave was almost non-existent. And, based upon the theory of alternation, it suggests that wave iv should take a long time. For this reason, I am expecting a wave iv to take us at least a day. And you can see my expectations on the 5-minute chart posted below.
The warnings that go with this structure is that the market “should” be holding the 2870/75SPX support at all points here. Should we see a break down below 2870, it would suggest that either the market is going to trace out an ending diagonal for the [c] wave, or it has completed wave 2 in a w-x-y fashion.
So, as long as the market maintains over 2870/75SPX support, I am looking for two higher highs, with an ideal target in the 2920SPX region.
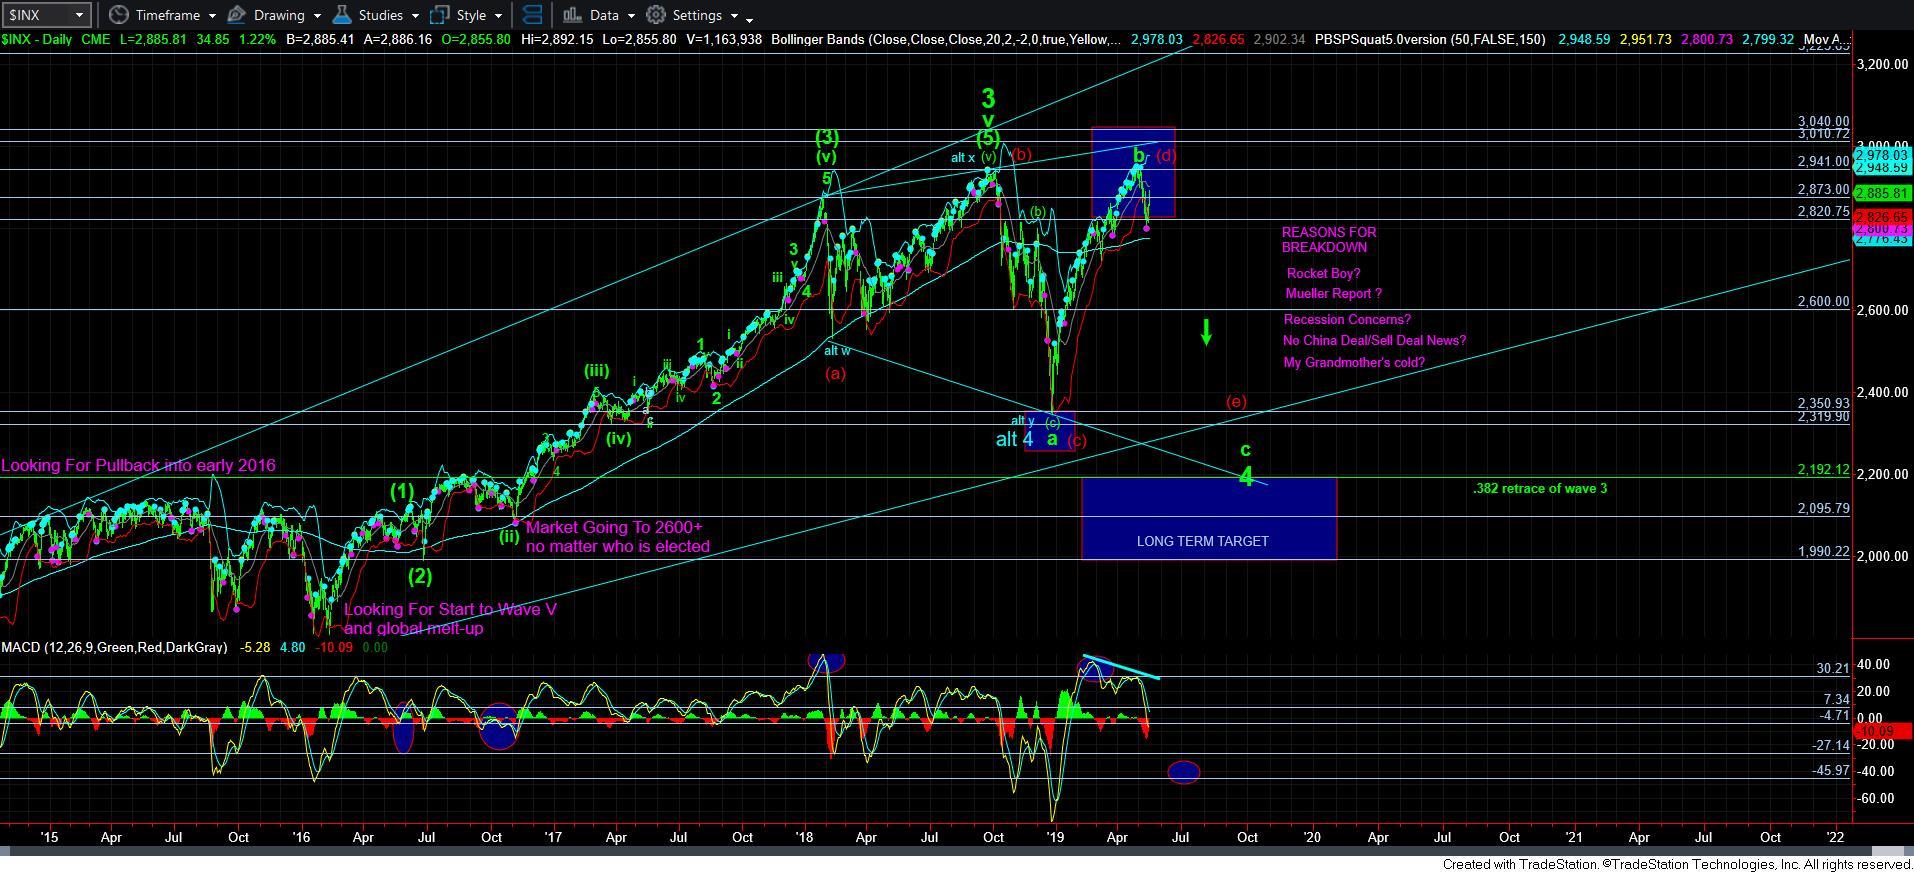
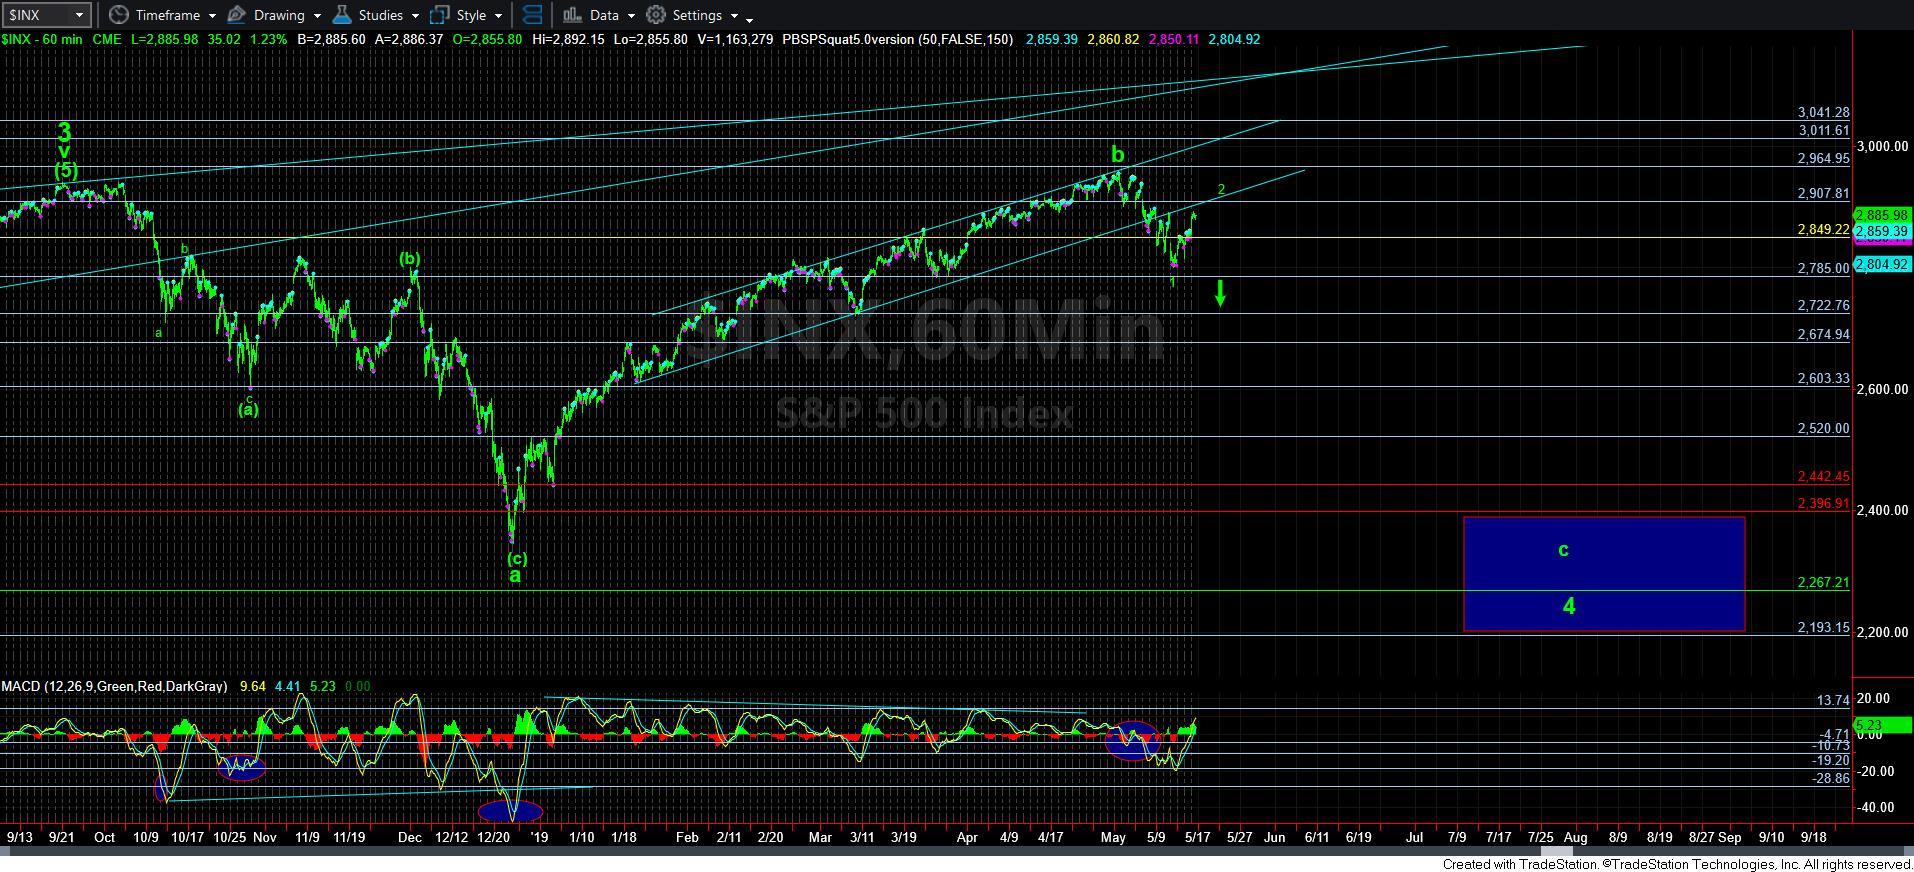
Lastly, while it is still “possible” that the market can take us to a marginally higher high towards that 3000 region, I don’t see that as the most likely scenario at this time. It would take a break out over 2930SPX to suggest that potential. But, as long as we remain below 2920/30SPX, I am viewing this rally as a terminal wave 2, which will be pointing us down strongly into the end of May, and potentially through June.