What Do We Know?
I am going to take a step back this evening, and come at the analysis from a bigger perspective, and then try to hone in on the smaller perspective.
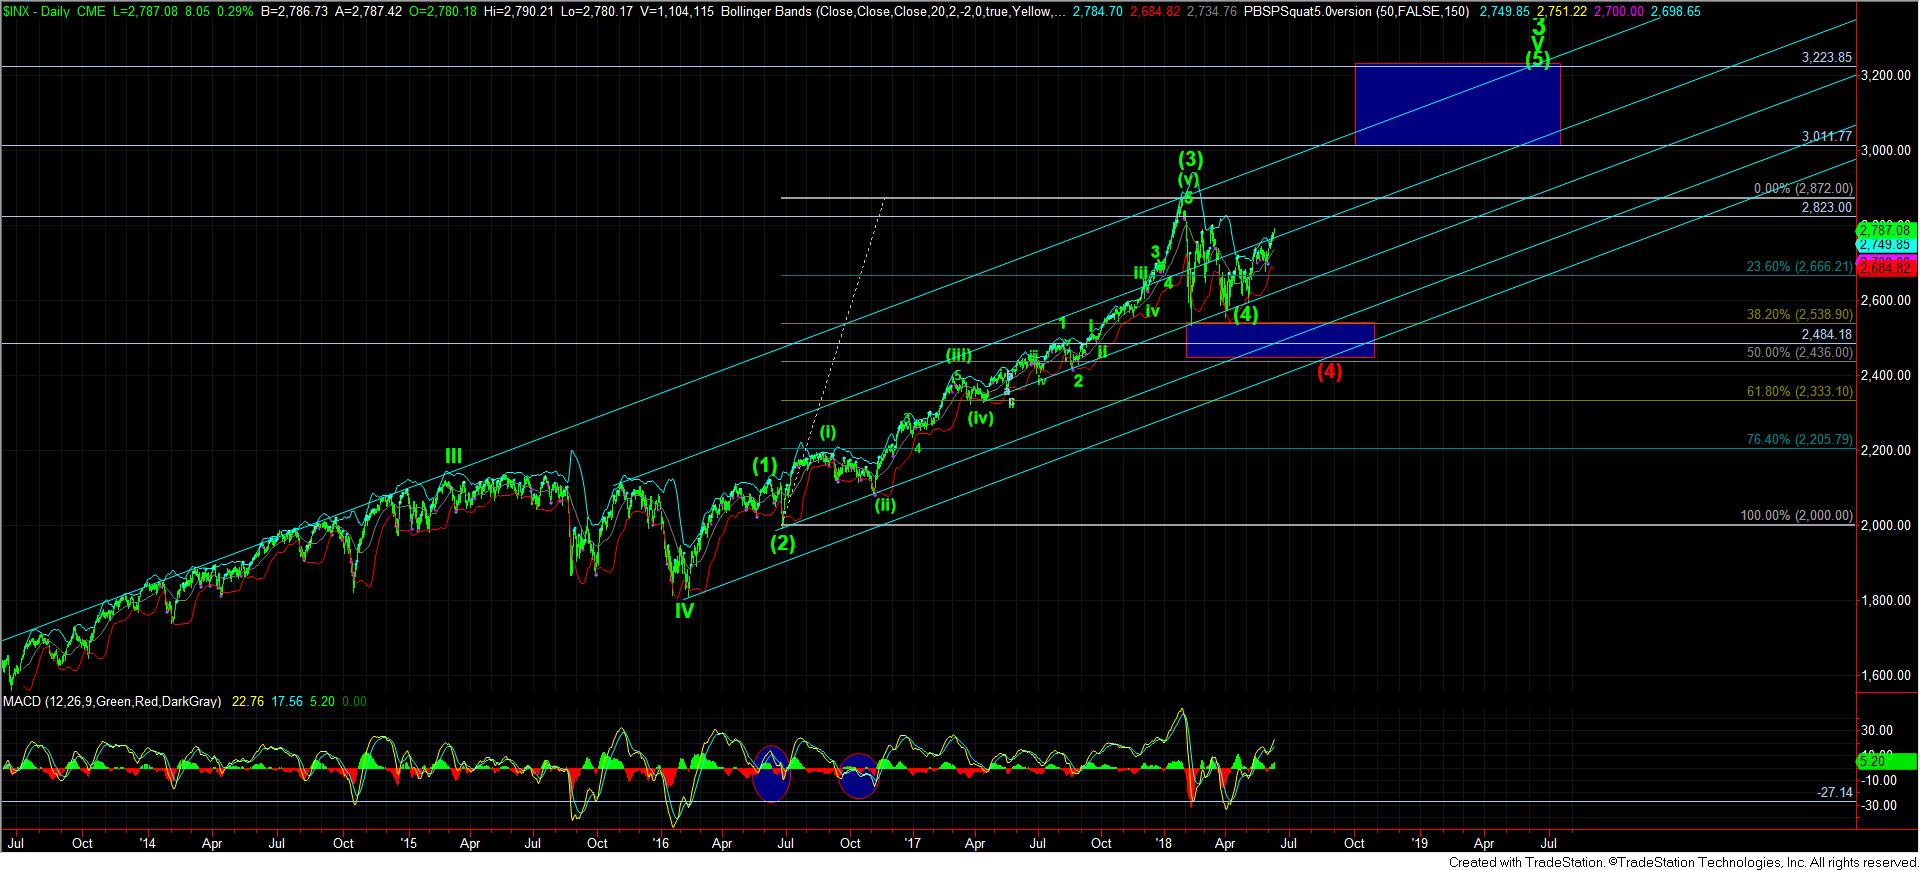
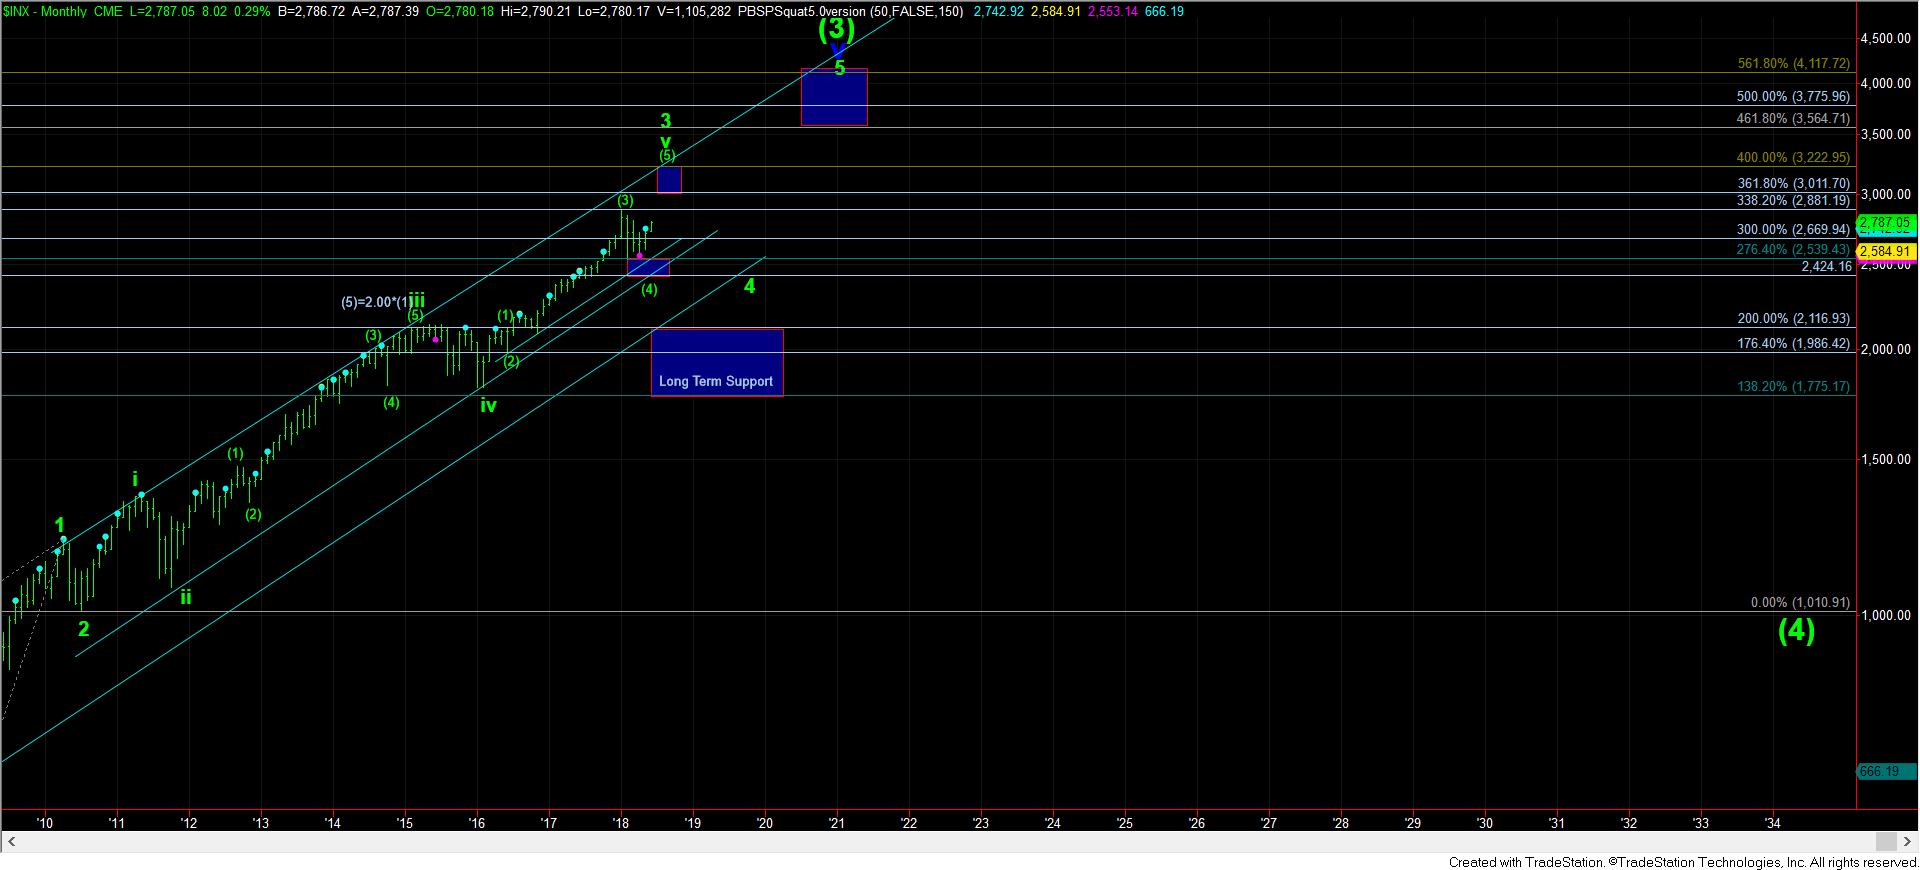
First, let’s start with what we know, at least from a probabilistic perspective in our larger degree analysis about the market. We know that we had a wave (4) target of 2424-2539SPX. We know that the market struck a low of 2536SPX in February. We know that our wave (5) target is 3011-3225SPX. We also know that a top at 2823SPX which then drops below 2760SPX in impulsive fashion can point us down to 2480SPX in a larger degree wave (4). We also know that wave (4) has not provided us with a conclusive c-wave down, which is how the great majority of corrections complete.
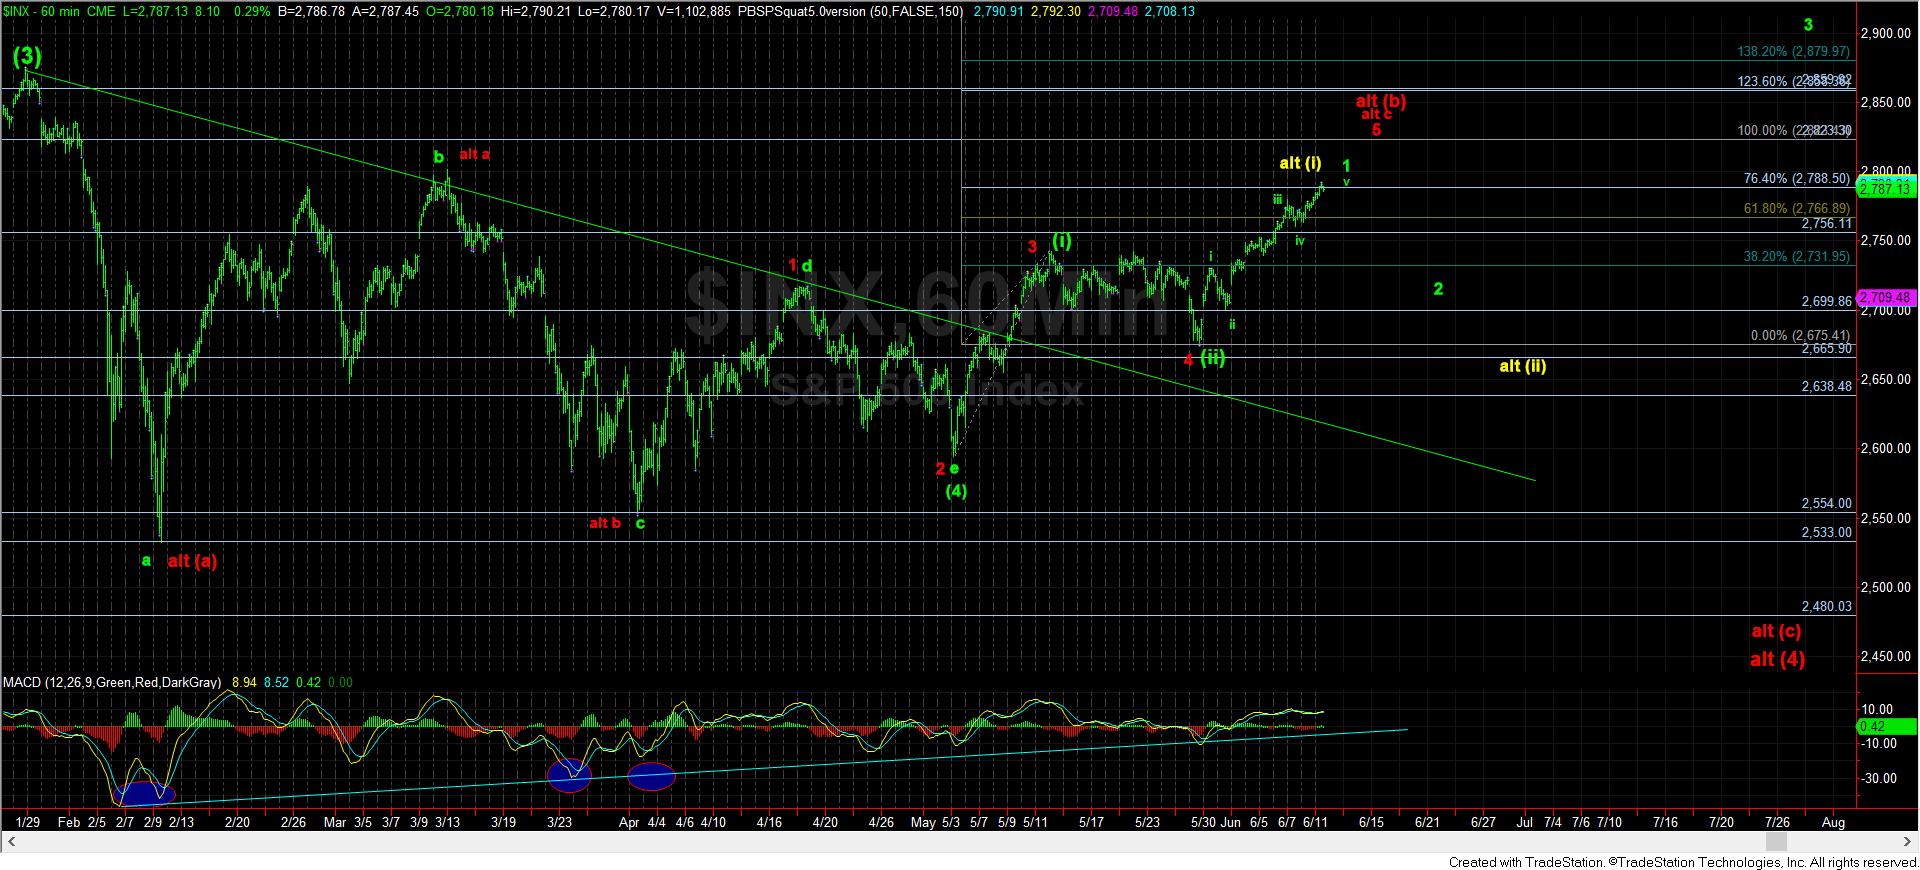
Now, the main reason we still have the “unknowns” listed on our 60-minute chart is due to the lack of a clear ending to wave (4) in a standard c-wave down. That fact alone has caused us to be uncertain as to whether wave (5) has in fact begun, and HOW it has begun. While it has become much more likely that wave (4) has concluded, the market has not yet clarified with which structure we will be heading up to 3000+.
As you can see from the 60-minute chart, there are two immediate bullish counts on our chart, and each has its “issues,” at least from a standardized perspective. Whereas the green count has wave 1 already slightly exceeding the .764 extension of waves (i) and (ii), this is not a common extension for wave 1 of (iii). However, if we were to view the yellow count as the operative count, it is also not common to see a 5th wave be equal to .764 of waves 1-3. (And, I have not even noted the larger leading diagonal that Zac has been following because I only follow leading diagonals when it is the last possibility I am following).
So, again, from a standardized perspective, each of these counts has their respective issues. This is why I am going to maintain a bit more patience while the market resolves these issues before I can trade any smaller time frames more aggressively.
Now, in order for us to even consider that a 2nd wave is in progress, we will need to see a break below 2756SPX, which would represent the .382 retracement for what MAY be a 4th wave pullback in the red count. Should we see a sustained break of that level, then we will be looking for a-b-c structure to consider a bottom to a green wave 2. Yet, if the market only rallies correctively off such a bottom, it would alert us to prepare for a deeper a-b-c structure in wave (ii), now presented in yellow.
As I noted above, and many times before, the lack of a clear ending to wave (4) forces us to take this one step at a time. But, even so, our focus is going to continue attempting to nail down exactly how the market is going to take us to 3000+ in the coming months. For now, Mr. Market has not provided such perfect clarity.