What A Wild Day
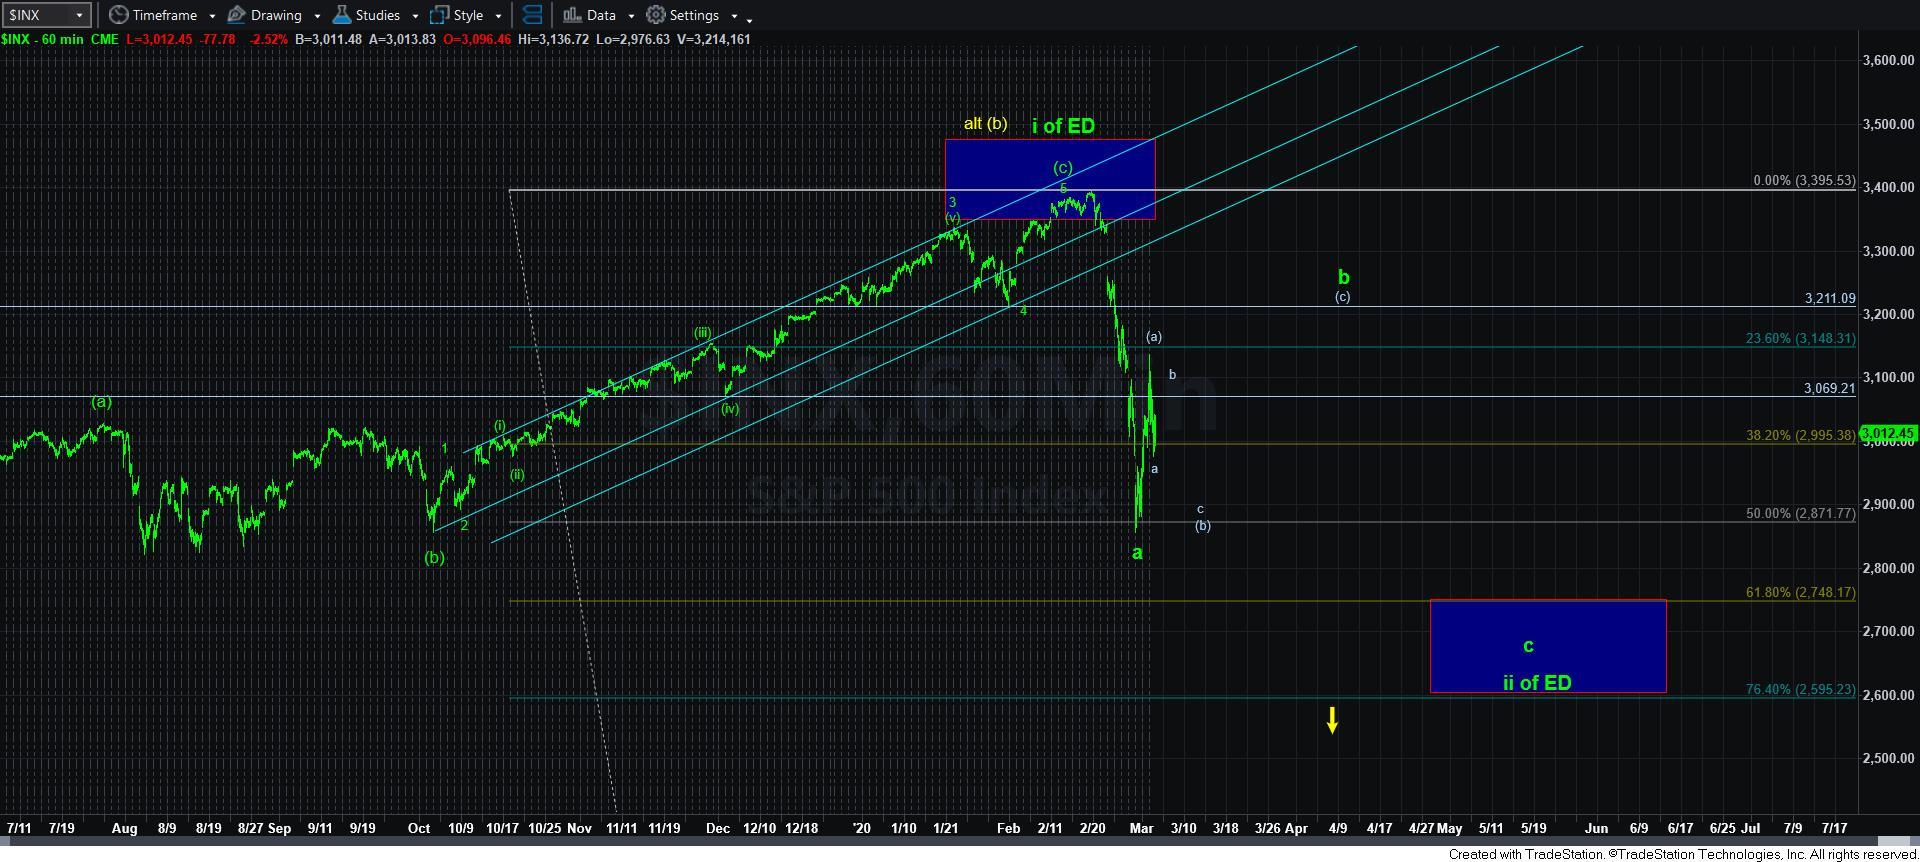
As the market was hovering over the 1.00 extension on ES this morning, it looked like we may see another stab higher before any downside may be seen. So, I outlined upper resistance this morning at the 3010-3035ES region And, with the announcement today, the market spiked right up to the top of resistance, and reversed 160 points down off that high. It certainly was a wild day.
But, I have to note that this type of action is really not typical of bull market action. Rather, this type of whipsaw really smacks of corrective action. And, I think I am going to have to continue to view it as such, unless the market can prove otherwise.
How can the market prove otherwise you ask?
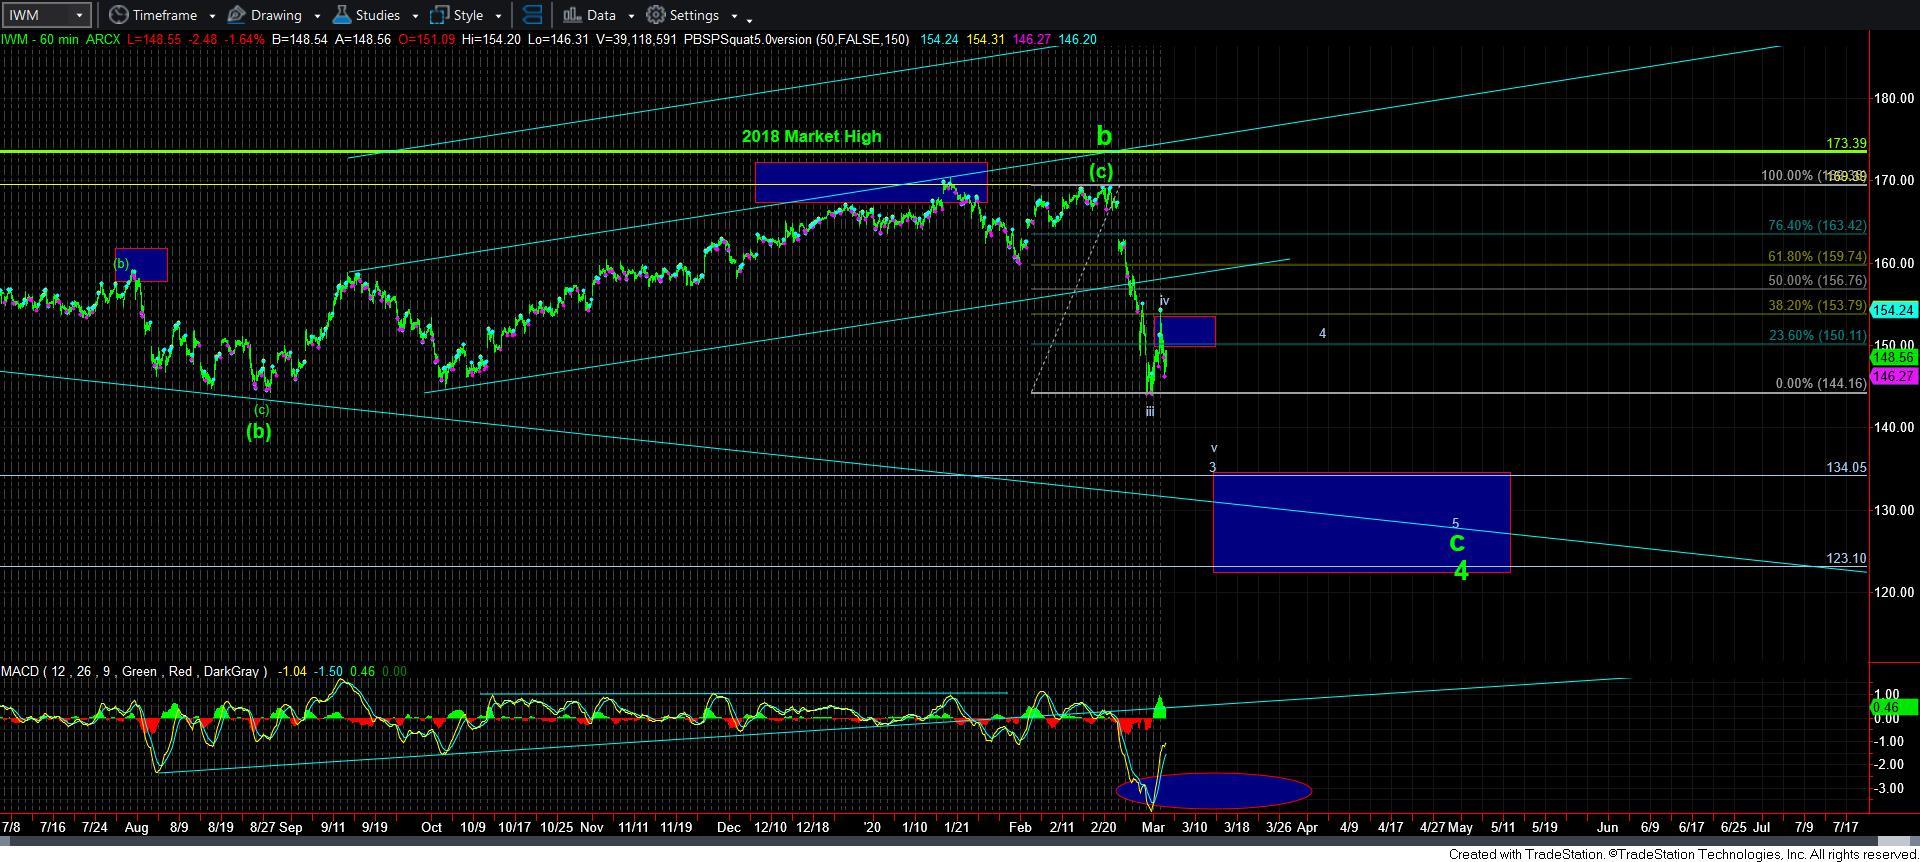
Well, going back to IWM, we came right up to the top of resistance today for what I still consider to be a wave iv of 3 down. If we see the IWM move through today’s high, we may have an initial indication that something more bullish may take shape. It MAY mean that wave ii could be done in the SPX, even though I think that is a lower probability at this time, especially as long as the IWM remains below today’s high.
Keep in mind that the IWM has been providing us what I would consider to be the “truth” in the market over the last year. And, if it is able to push through today’s high, it does put a question into the potential for us to continue lower in the c-wave down. But, before I address that with any wave counts, I would want to see how it breaks that resistance, if it does at all. For now, it has held as resistance, and I will look down as long as that resistance remains intact. Ultimately, the IWM would have to break through 156.60 to suggest that something more bullish may be in store sooner rather than later.
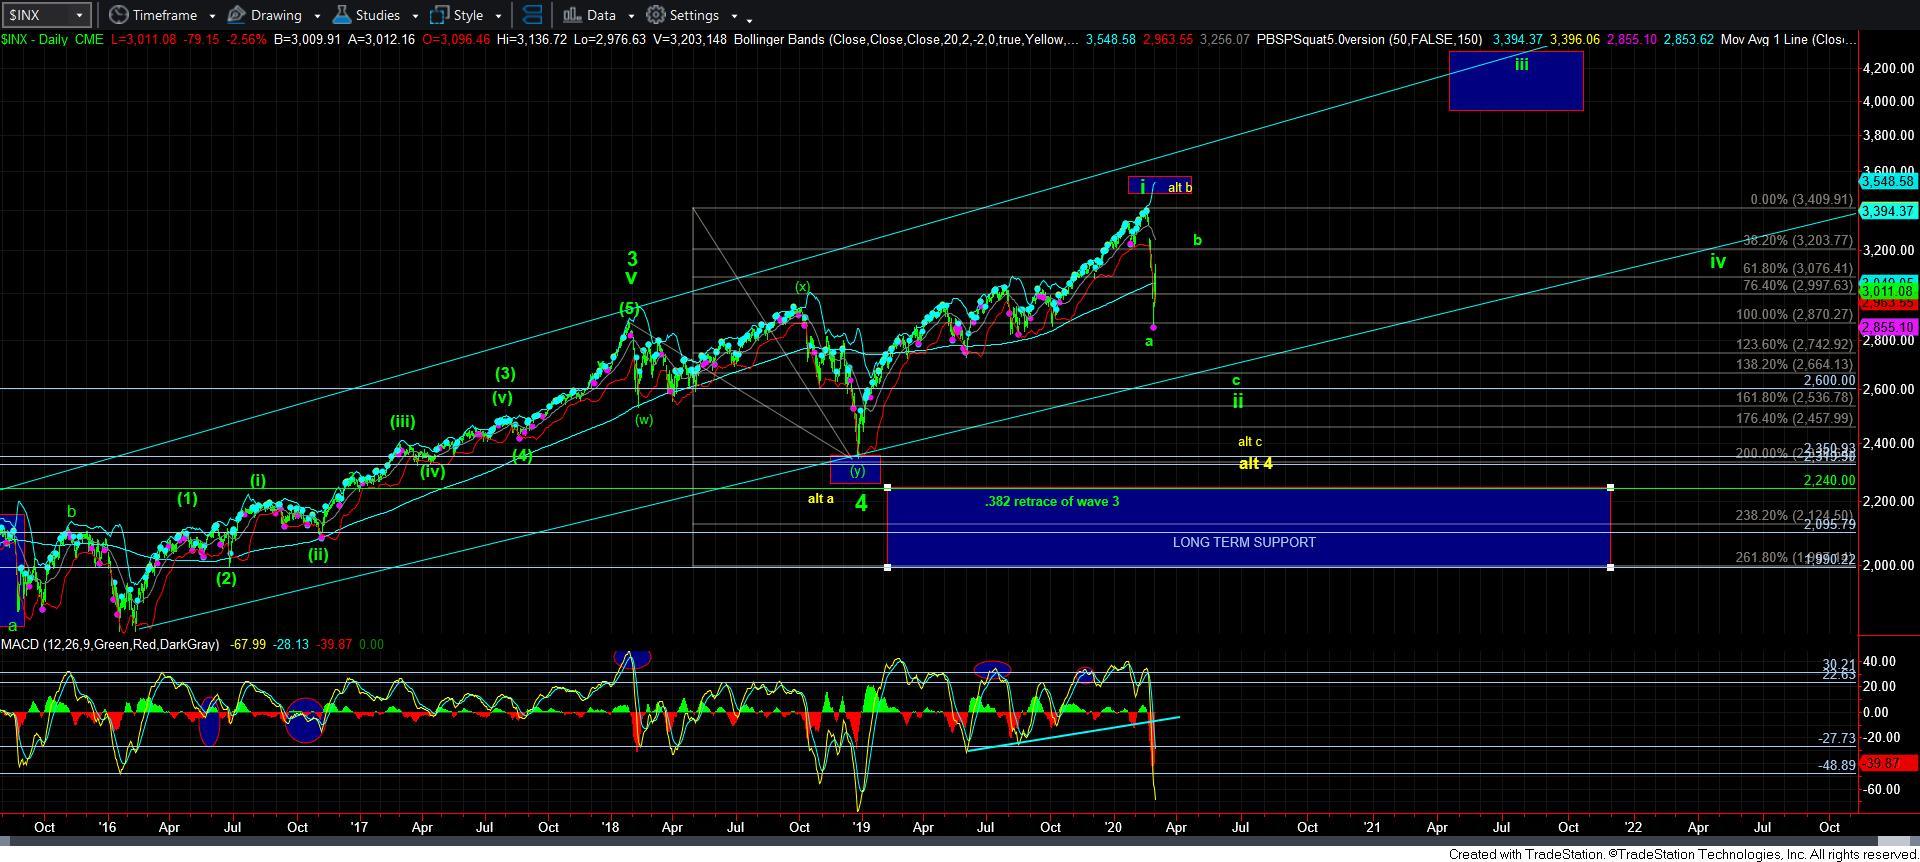
For those taking a bigger picture view, keep in mind that the bigger patterns are still likely pointing higher for a 5th wave off the 2009 lows, with the SPX likely taking us beyond 4000, and the IWM with targets in the 210-240 region, as it stands today. I have outlined these potentials ad nauseum, but I want you to remain focused on this since this is what we are trying to set up our accounts for over the coming several years.
For now, as long as the IWM remains below today’s high, I can reasonably look lower for a 5th wave of 3. But, I want to add that the decline off today’s high was – at best – a leading diagonal, which I do not view as a strong trading cue. This does place a bit more risk into this chart if you are trying to trade this aggressively. If we would have had a clear 5-wave impulsive decline which adhered to Fibonacci Pinball, this would have been a much easier analysis to provide tonight. But, the overlapping downside structure leaves me with less than a ideal probability for further downside follow through, despite the larger count suggesting it as a preference.