Well, Market Has Become More Dangerous
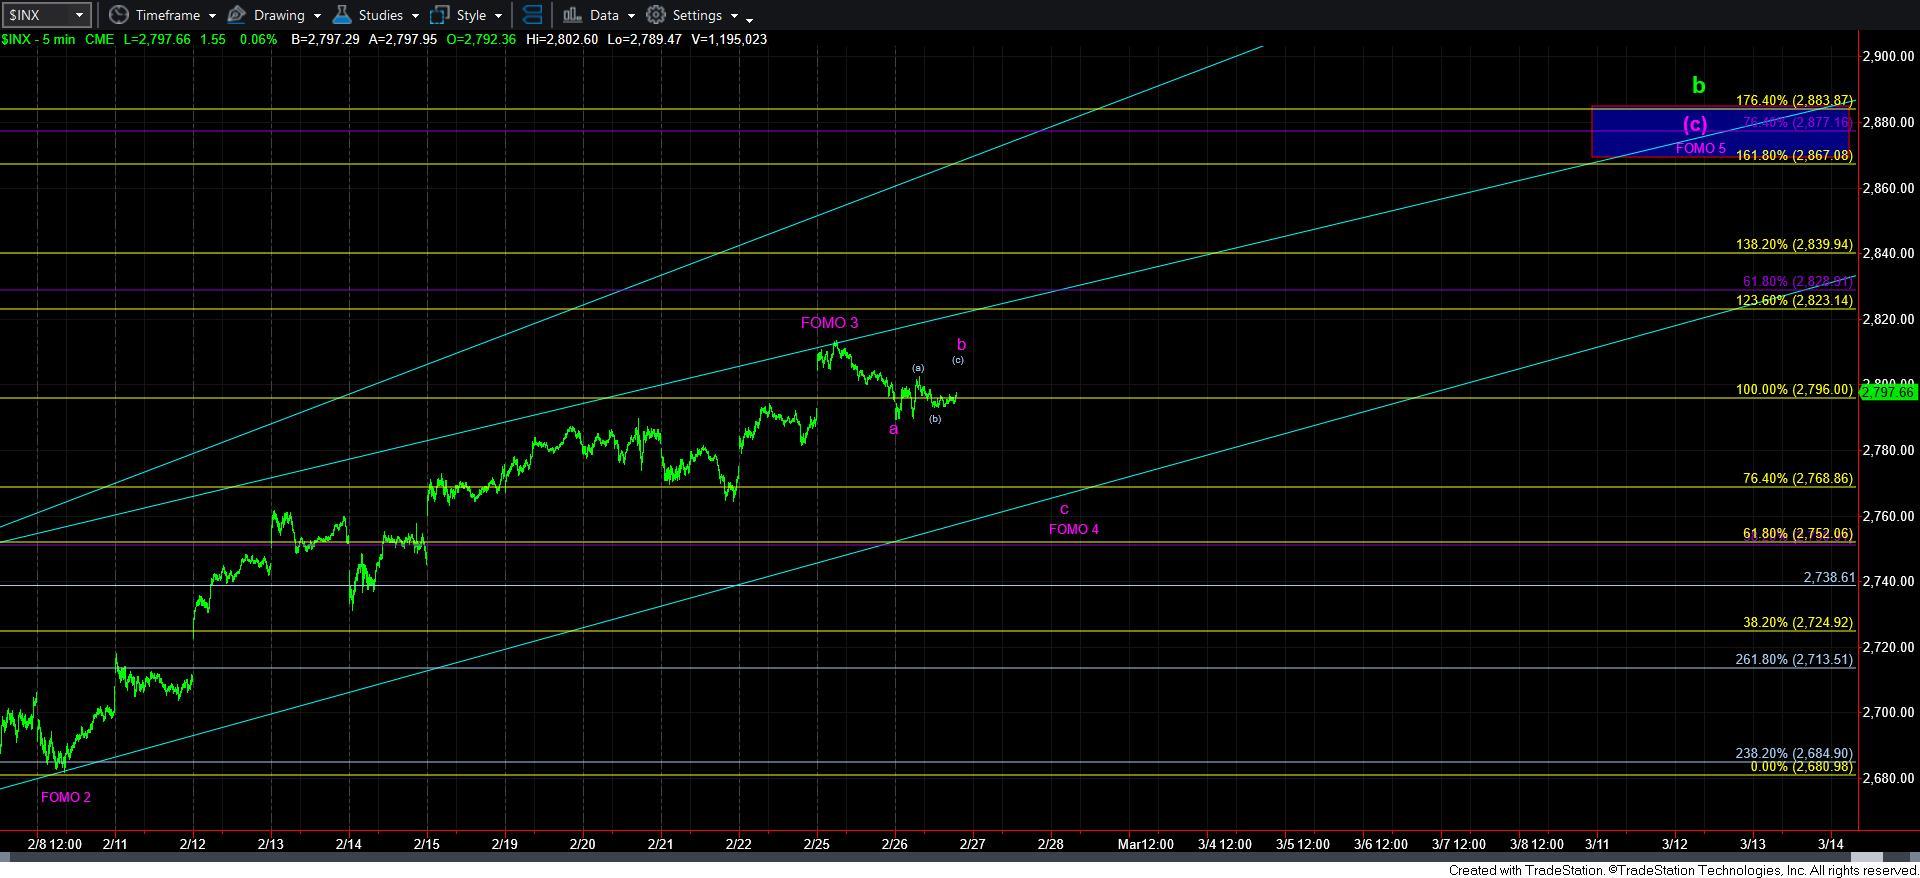
Unfortunately, the break down below 2796 on the S&P 500 (SPX) has morphed our pattern which was pointing to the 2875 region to complete this b-wave. While it is still possible that we will attain that target, I simply cannot be as confident as I would otherwise be if we had a standard impulsive structure pointing to that target.
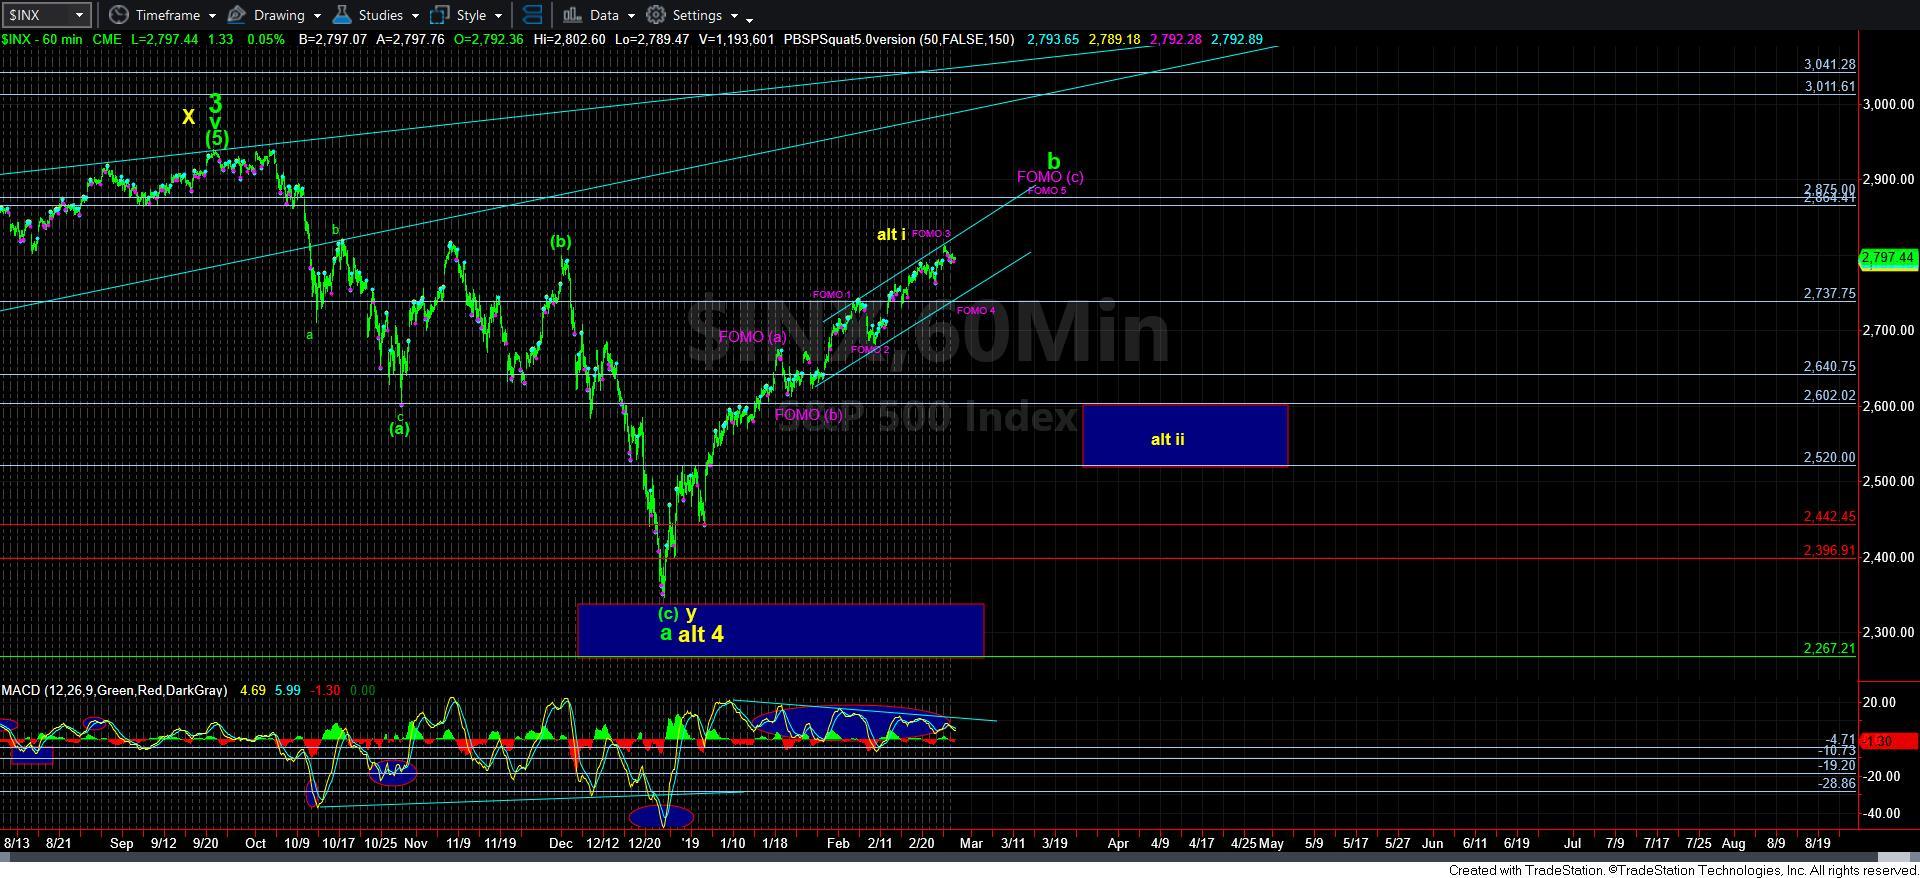
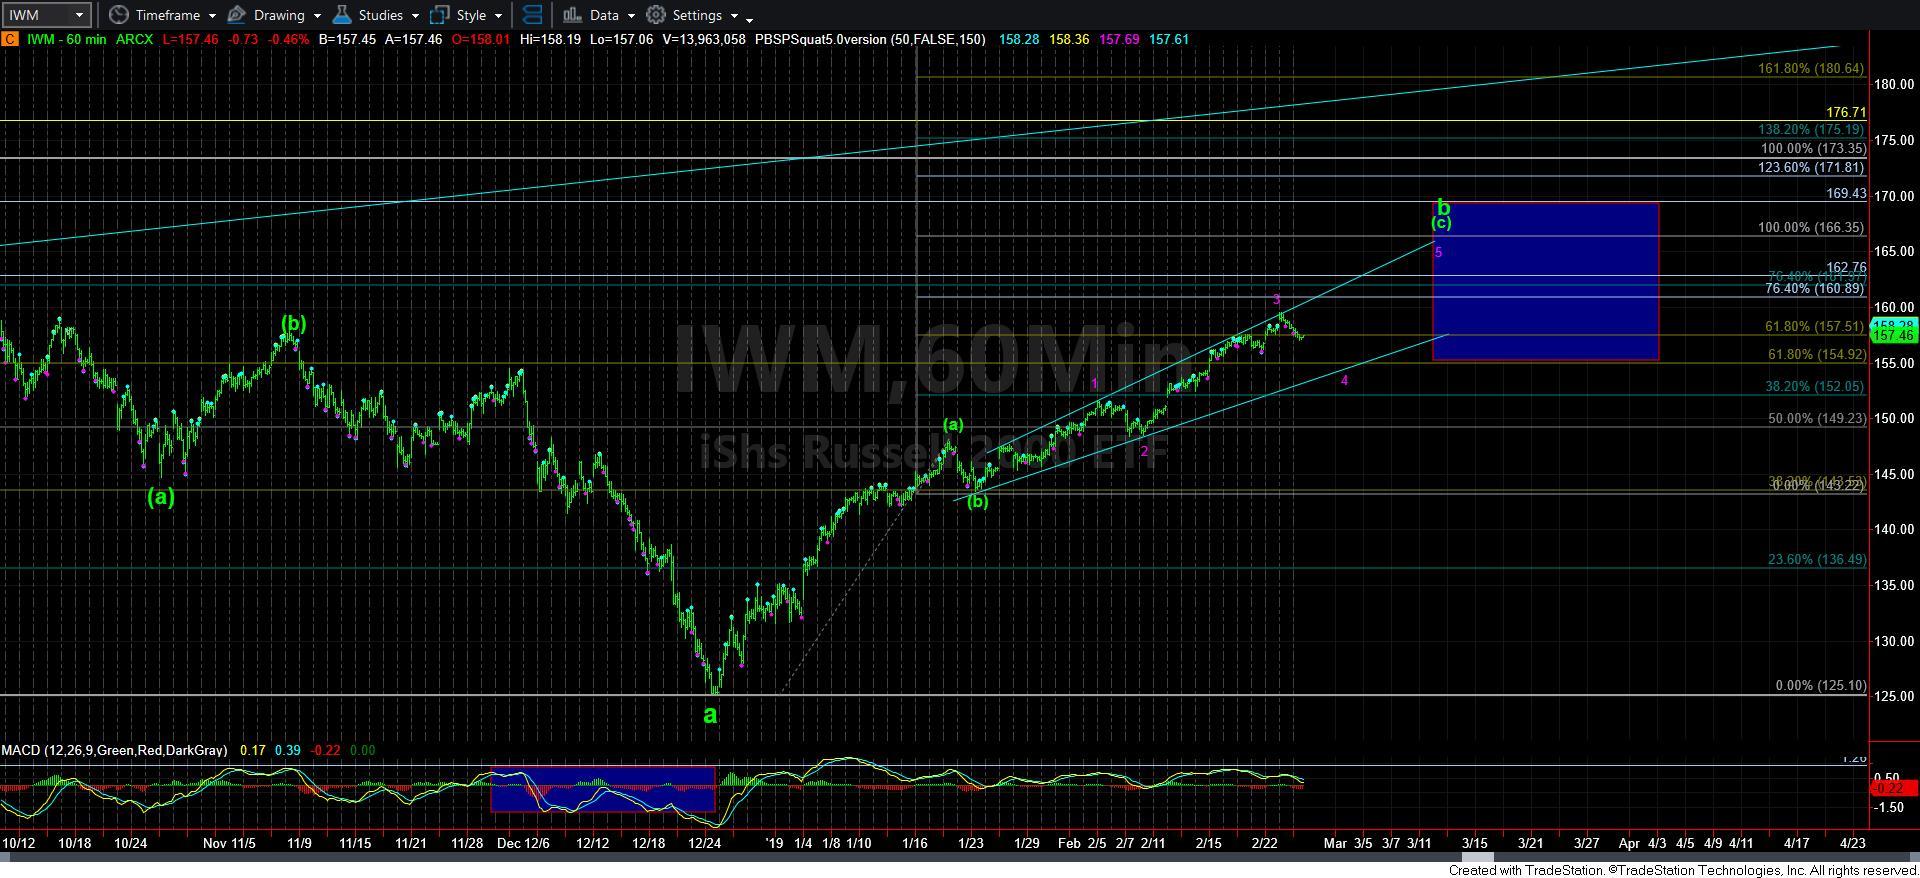
The drop we just experienced has caused overlap in our impulsive structure. That can mean many things. But, for now, I am interpreting it as morphing this [c] wave into an ending diagonal. And, as you can see from the attached IWM and SPX charts, it does fit both rather well.
But, as I noted yesterday, trying to trade for a 5th wave in an ending diagonal [c] wave within a corrective structure is fraught with peril. It is even still within the realm of possibilities that the top we struck was an [a] wave still, with a [b] wave pullback yet to come. While I do not have that on any of my charts right now, I may reconsider that potential if we break down below 2730SPX. And, yes, because we may have morphed into an ending diagonal, it does cause me to adjust my support to this [c] wave structure because diagonals have much larger swings.
The one count that I do not think is a high probability at this point in time is that the one which views the b-wave as completed. If the b-wave had topped, then the initial decline would have likely provided us with an impulsive 5-wave decline to begin the c-wave down. Thus far, we have not seen any clear impulsive decline, which means that the top to the b-wave has not likely been struck. So, for now, at least this potential goes to the bottom of the probability heap.
In the micro structure, it would seem that we have been spending time today working on a b-wave within the 4th wave pullback in the FOMO count. That would still need a c-wave lower before we can even consider it completed. And, again, both the IWM and the SPX support this count at this time. So, this is what I am now going to have to track as my primary count, despite my viewing this as a dangerous count. However, should this count fill in waves 4 and 5, it will likely result in a very strong reversal back down to where the diagonal began. That is a typical market reaction once a diagonal completes.
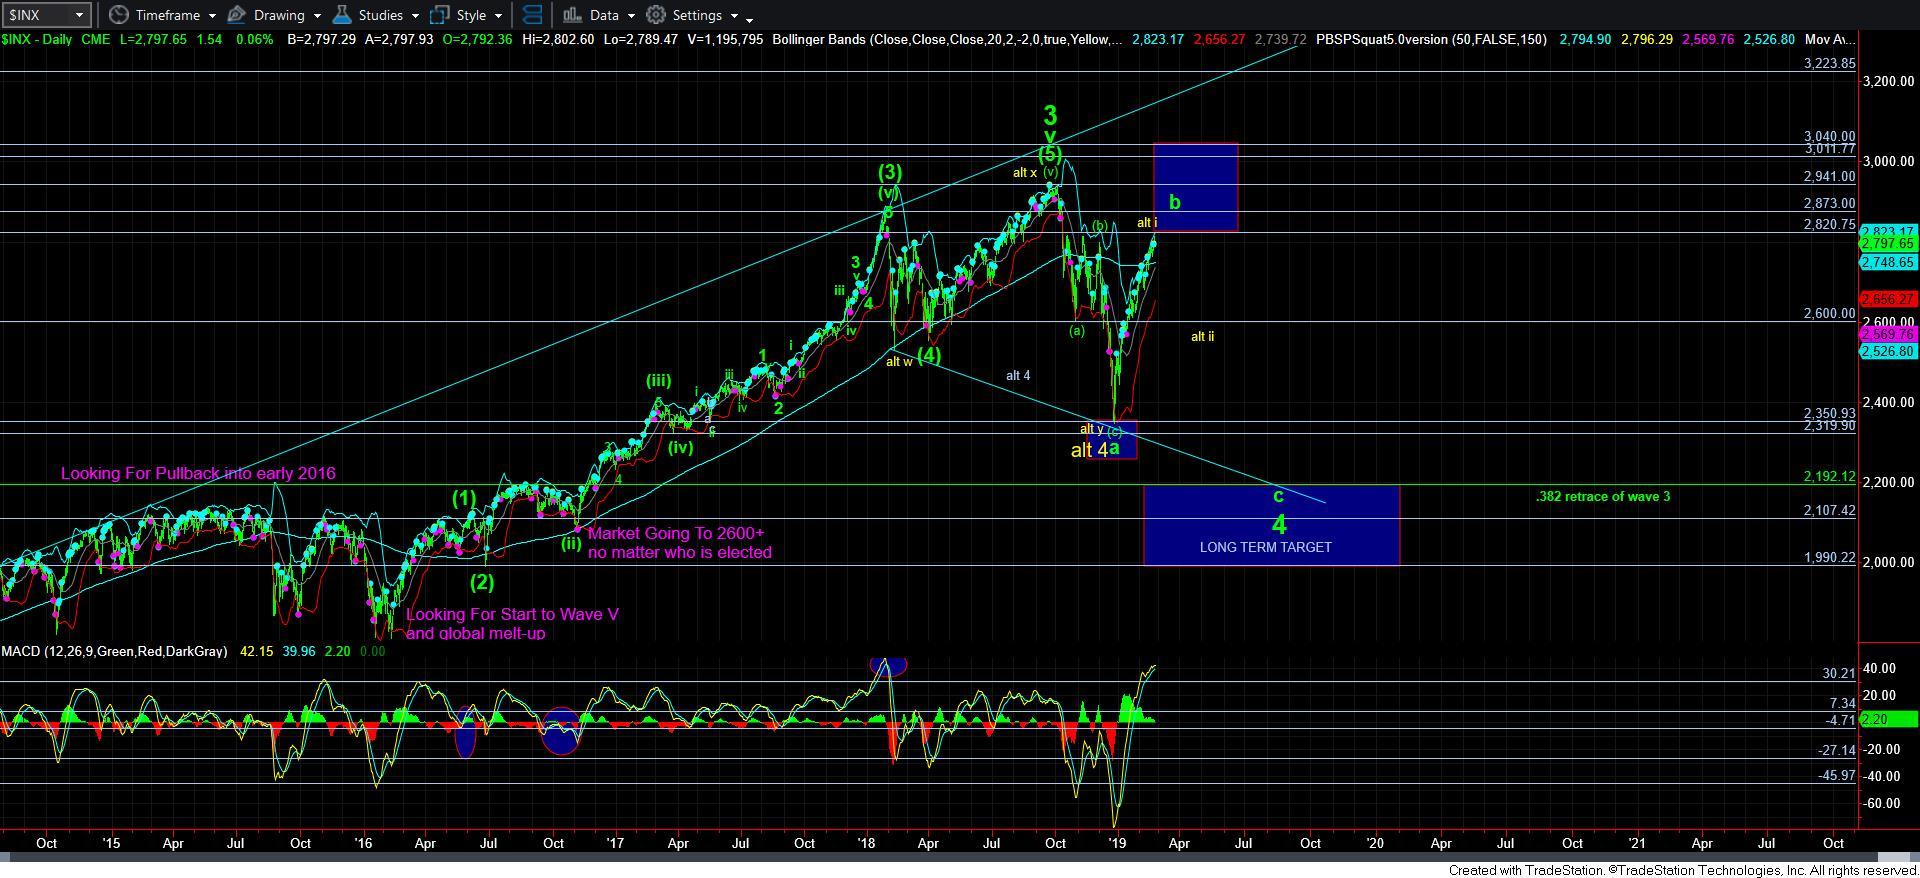
Moreover, that initial downside target would be in the 2600-2650 region once we complete the ending diagonal for the [c] wave, and “should” represent wave 1 in the c-wave down. And, should we see such a set up, it would point us down to AT LEAST a double bottom in the 2300 region in the SPX, but, more ideally, I would expect the 2100-2200 region ideal target to be attained if we see a wave 1 down into the 2600-2650 region.
But, I am getting way ahead of myself. As I have noted in the alternative count, it is “possible” that drop can be a wave ii as presented in the yellow count. So, it will all depend on whether the market provides us with a clear 5 wave decline structure or if the downside is clearly corrective. So, as always, I will listen to what the market tells me, and act accordingly. But, for now, my expectation remains that this larger degree 4th wave has not yet completed, unless the market tells me otherwise.