Weighing The Risks - Market Analysis for Sep 17th, 2024
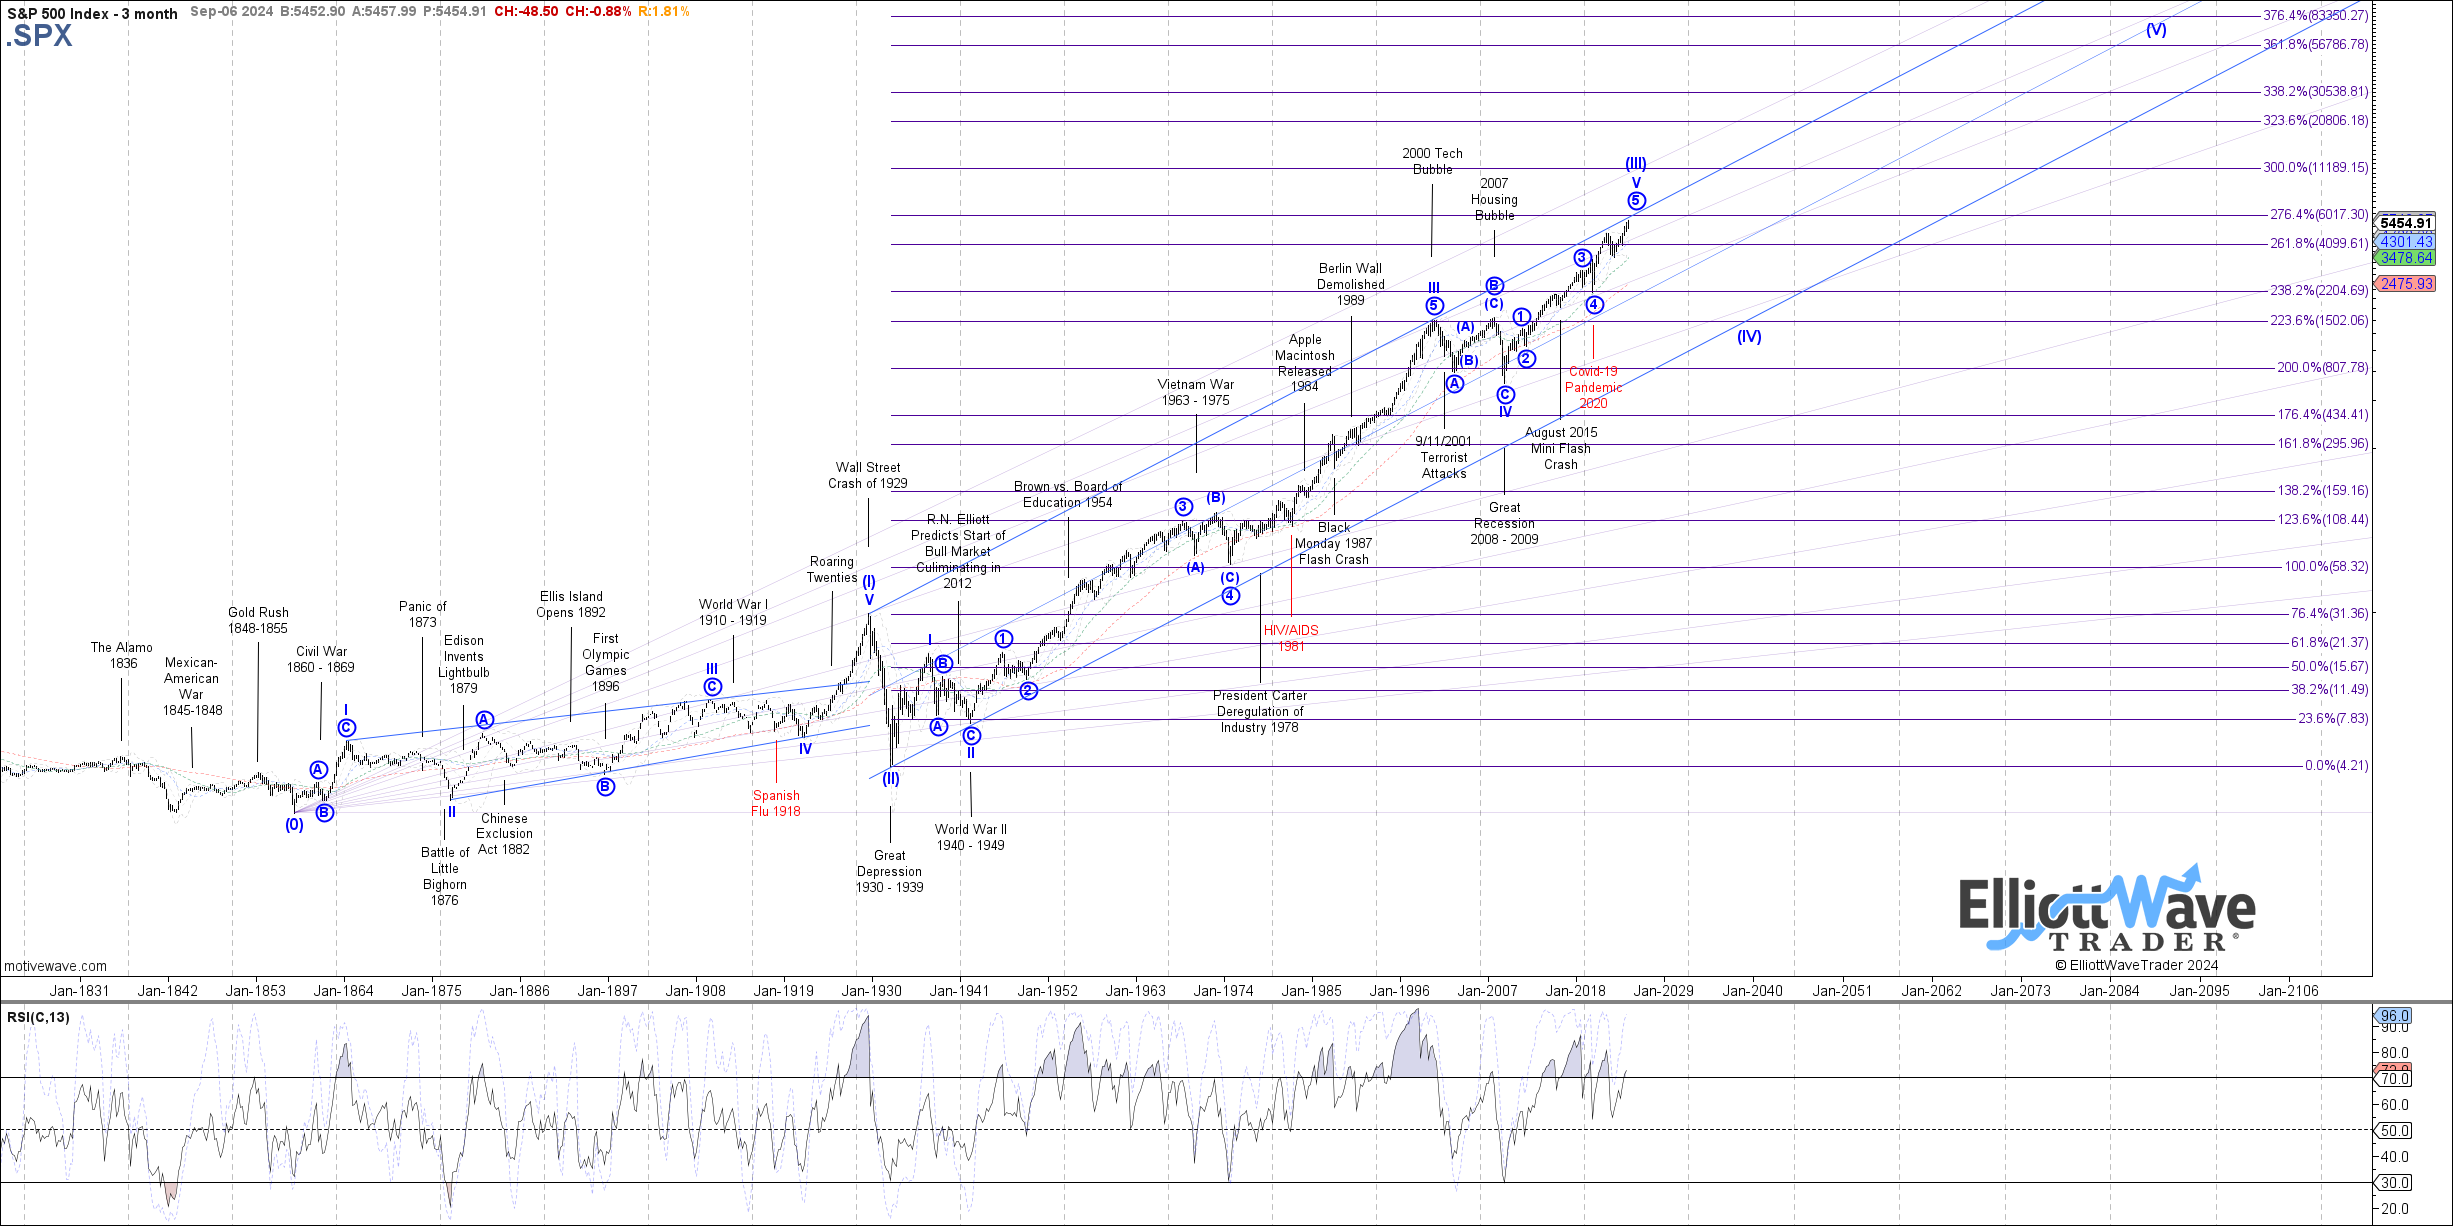
I am going to be brutally honest in my update this afternoon, and explain that I have carried a very heavy burden with my analysis over the last year. Whereas on one side of the equation I have had an eye quite focused on the long-term 100+ year SPX chart I have included below. Yet, at the same time, I have to outline where I see potential for the market to continue higher. And, it has caused me to be cautious at certain turning points, at least until the bulls provided me with a clear set up pointing much higher.
We are again at such a point in the market.
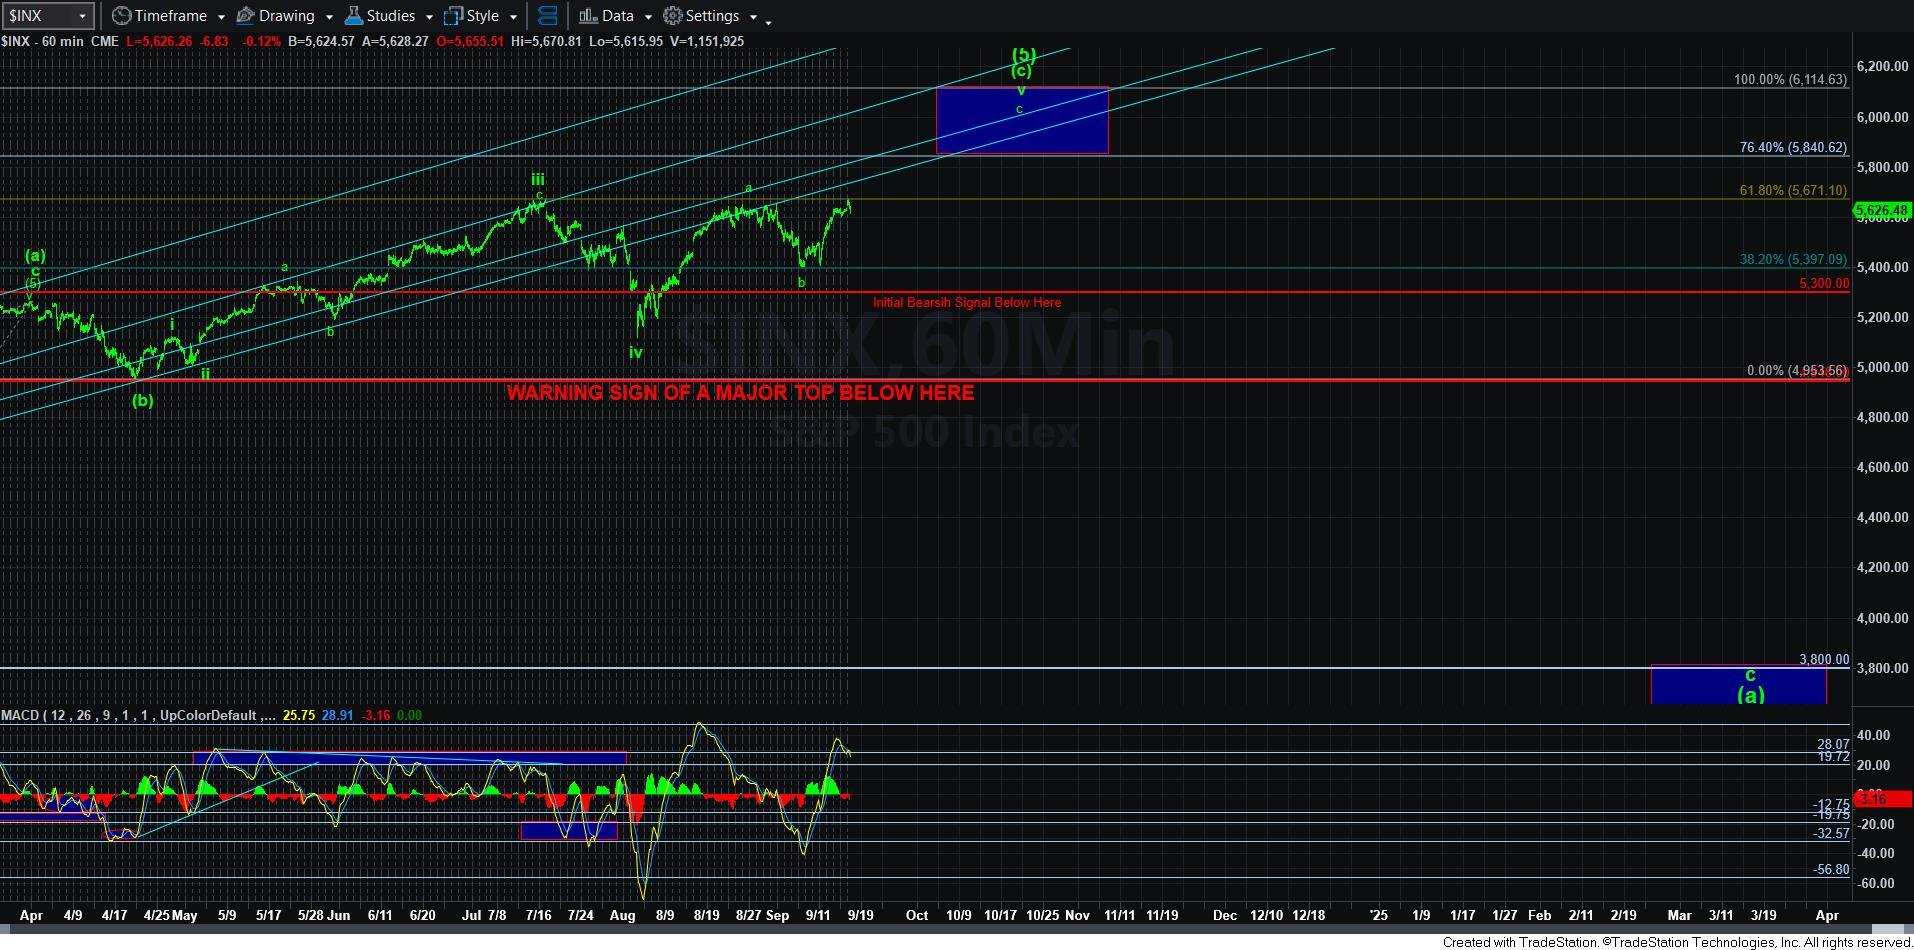
While I had wanted to see a 5-wave structure rally off the recent low we struck, I really did not want to see it make a new all-time high, as it adds a wrinkle. Allow me to explain.
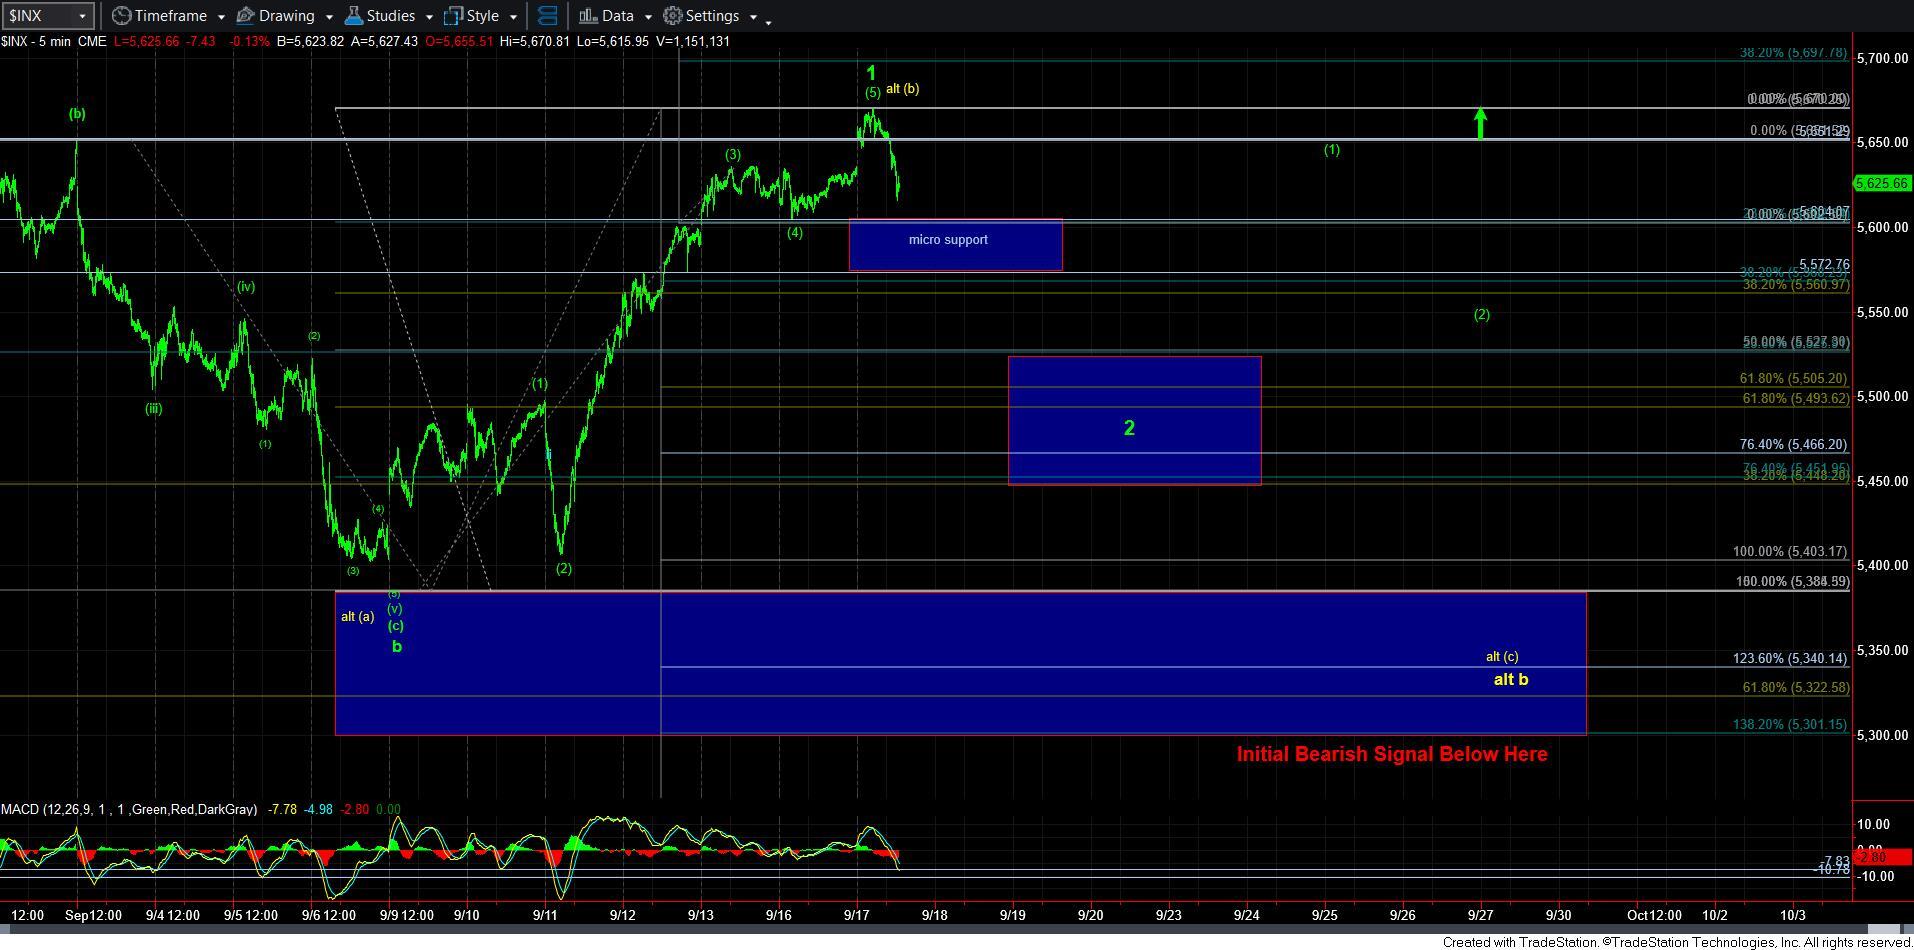
I want to first note that I am maintaining my primary count as shown, with the expectation that we will see a corrective wave 2 once this rally completes. So, in our primary count, the market still seems to be stretching in it wave 1 of a c-wave. I have added a micro support to the 5-minute chart, which would need to be broken to strongly indicate we are in the next decline phase, which, again, the primary count would see as a wave 2 – as long as it is corrective in nature.
Moreover, keep in mind that the higher wave 1 stretches, the higher the 1-2 structure will likely project. So, once we know where wave 2 bottoms, we can then narrow down our target region above.
Yet, I also want to address any potential bearish path as well.
This now brings me to the issue of risk, which I am required to weigh at all times given the perspective that we are nearing the completion of an almost 100-year long rally structure.
With the higher all-time high we have struck today, there is some potential that this 5-wave structure could complete the larger degree rally structure in a bit of a shortened manner. Again, while my primary count suggests that we have one more rally yet to come in waves 3-4-5, it would be prudent for those that bought at my suggestion two Fridays ago near the lows to lighten up on your positions until the market provides us with a CLEARLY corrective wave 2 pullback.
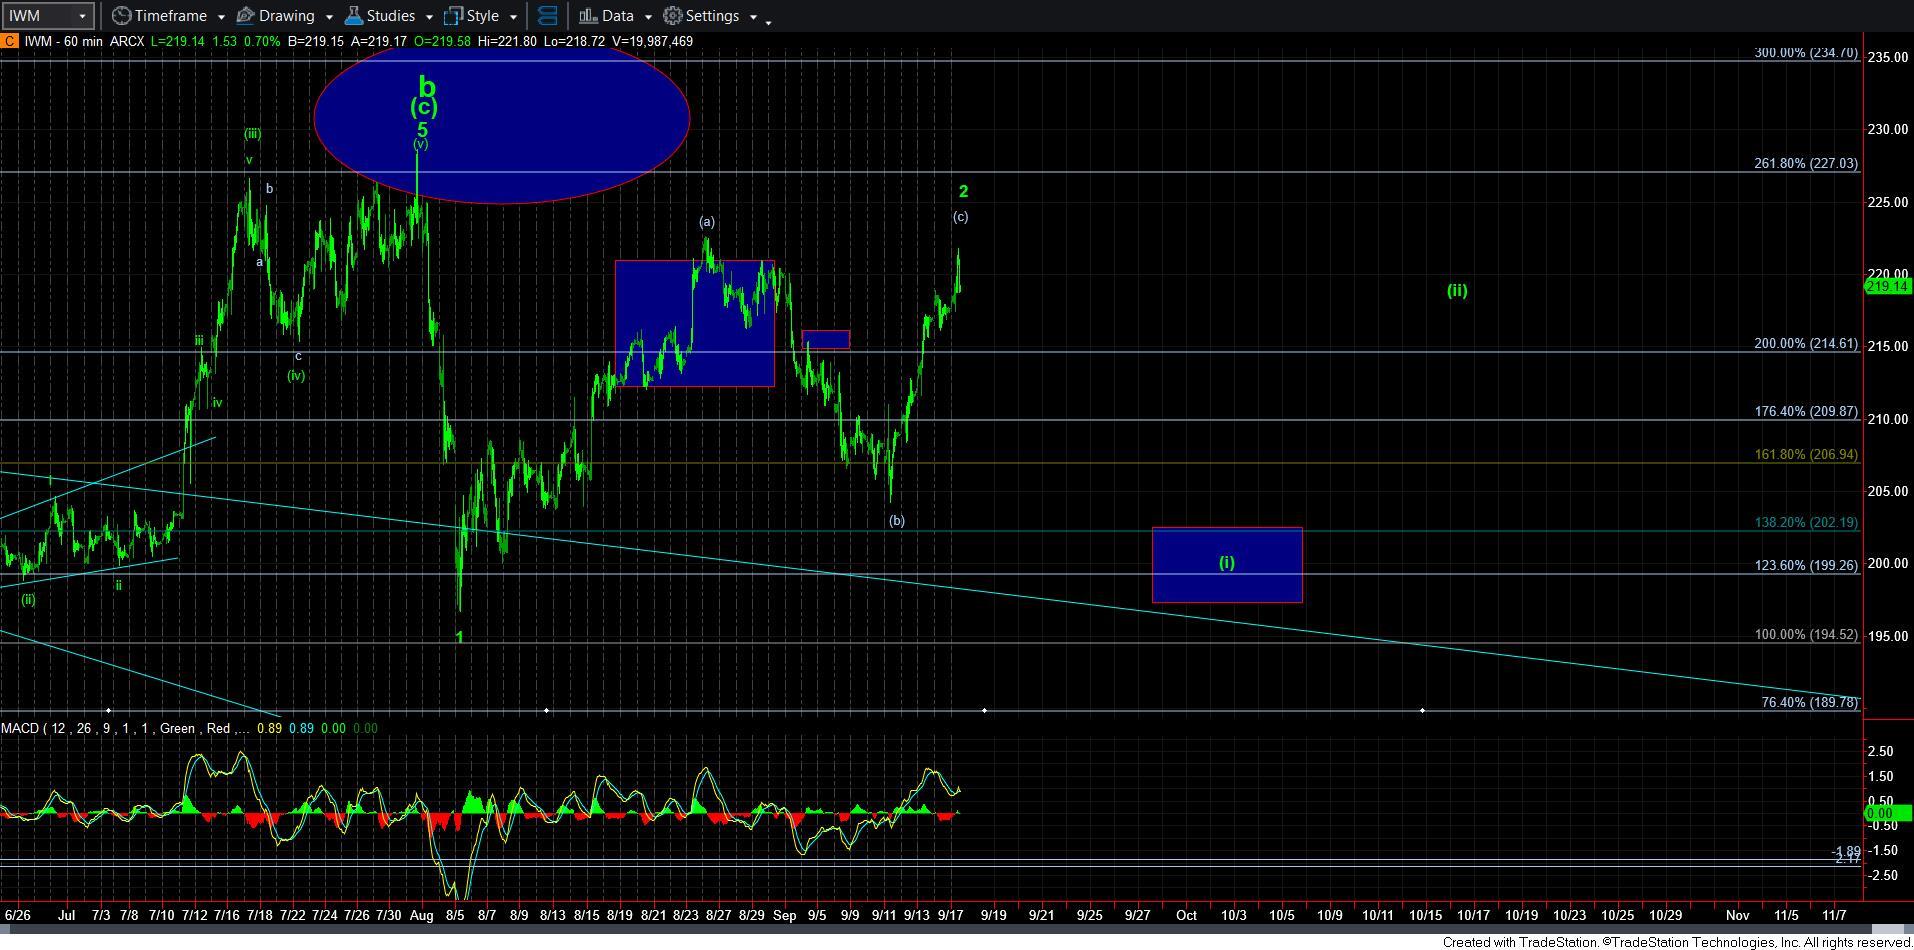
The other factor that I am considering again is the IWM. As you know from my prior posts on IWM, we did not complete 5 waves down. However, with this rally, we could count this as a [c] wave in a bigger wave 2. But, in all honesty, I actually have been tracking 4-5 different patterns in the IWM, and this is just one of those. Yet, it is one that I simply cannot ignore.
So, in summary, I want to stress how important it is for the market to provide us with a corrective pullback that holds the wave 2 support box over the coming week or so. Should that be the case, I would consider buying long positions, and adding to them after a further [1][2] structure completes.
However, due to the higher all-time high we struck today, should we fail to hold support in the wave 2 box, I will be adding an alternative that the market has indeed topped. Whether I make that my primary count is yet to be determined. I will have to see how the SPX and the IWM take shape before I can make that assessment.
The main point I want to make in this update is that this higher high in the SPX has added some amount of additional risk that I would not have outlined if the wave 1 had topped below the prior higher highs.


