We May Not Get That Last Pullback
As the market set up in what I am counting as a (i)(ii), i-ii in the most bullish wave structure off the April lows, I ideally wanted to see one more (1)(2) play out, with a wave (2) pullback still to be seen. However, when the market sets up to break out in a heart of a 3rd wave, sometimes that last 2nd wave gets hidden within the structure. This may be what we have seen here.
As an aside, it is for this same reason that whenever the metals had the same potential set up, I always gave the bulls the benefit of the doubt since this does happen as a 3rd wave sets up, yet, sometimes does not follow through.
When we completed a potential 5 up yesterday, I wanted to see the market pullback into today. That means that the overnight structure should NOT have presented bullishly after the initial pullback off the highs. Yet, when the market then provided us with a micro-bullish potential set up in the overnight hours, I had to send out an alert noting this potential to our members.
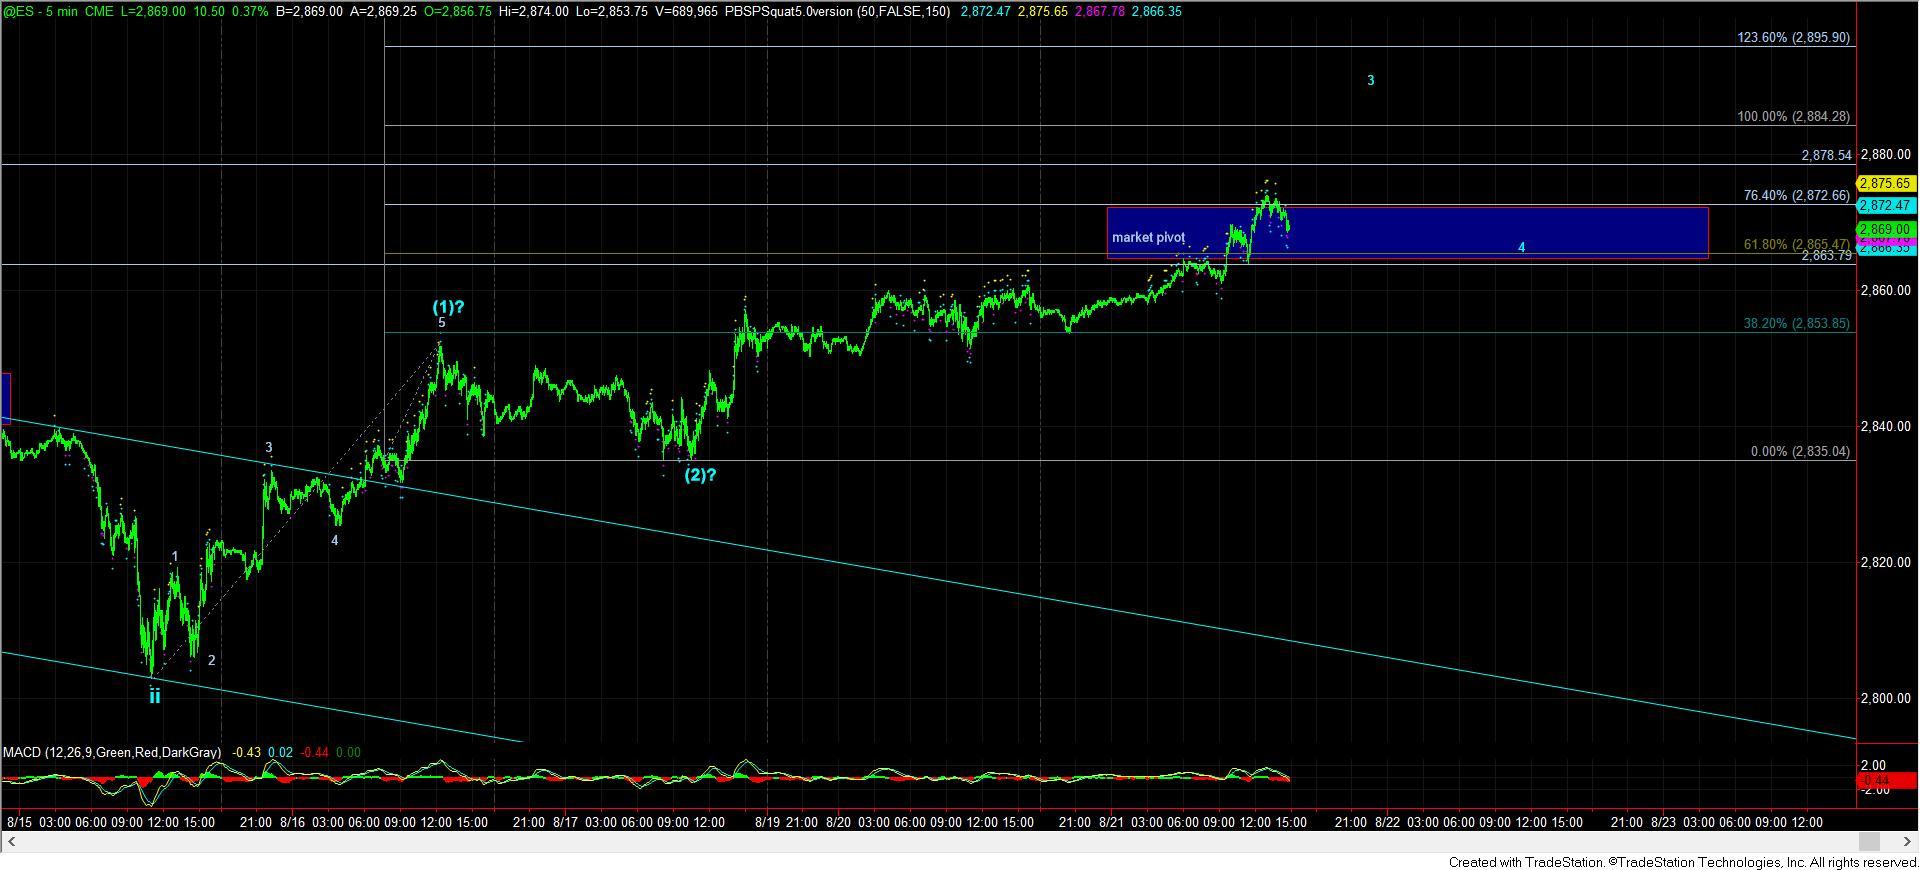
Within that alert, I noted a structure I was “watching,” but really only discussed on my live video, since I did not see it as a higher probability potential. That structure presented as a non-overlapping leading diagonal off last week’s low. But, that structure was only visible in the ES, as the SPX did not display the same structure. For that reason, I noted it was a bit “hidden.”
You see, I usually trust the SPX structure more than the ES. Moreover, non-overlapping leading diagonals are not terribly common. And, even when it does happen, the 2nd waves are usually deep retracements. In our case, we only saw a .382 retracement, which is usually typical of a 4th wave, not a 2nd wave, and certainly not a 2nd wave of a diagonal. Ultimately, due to all these issues, it made me view this potential as lower probability. Yet, sometimes, those lower probability structures do come through.
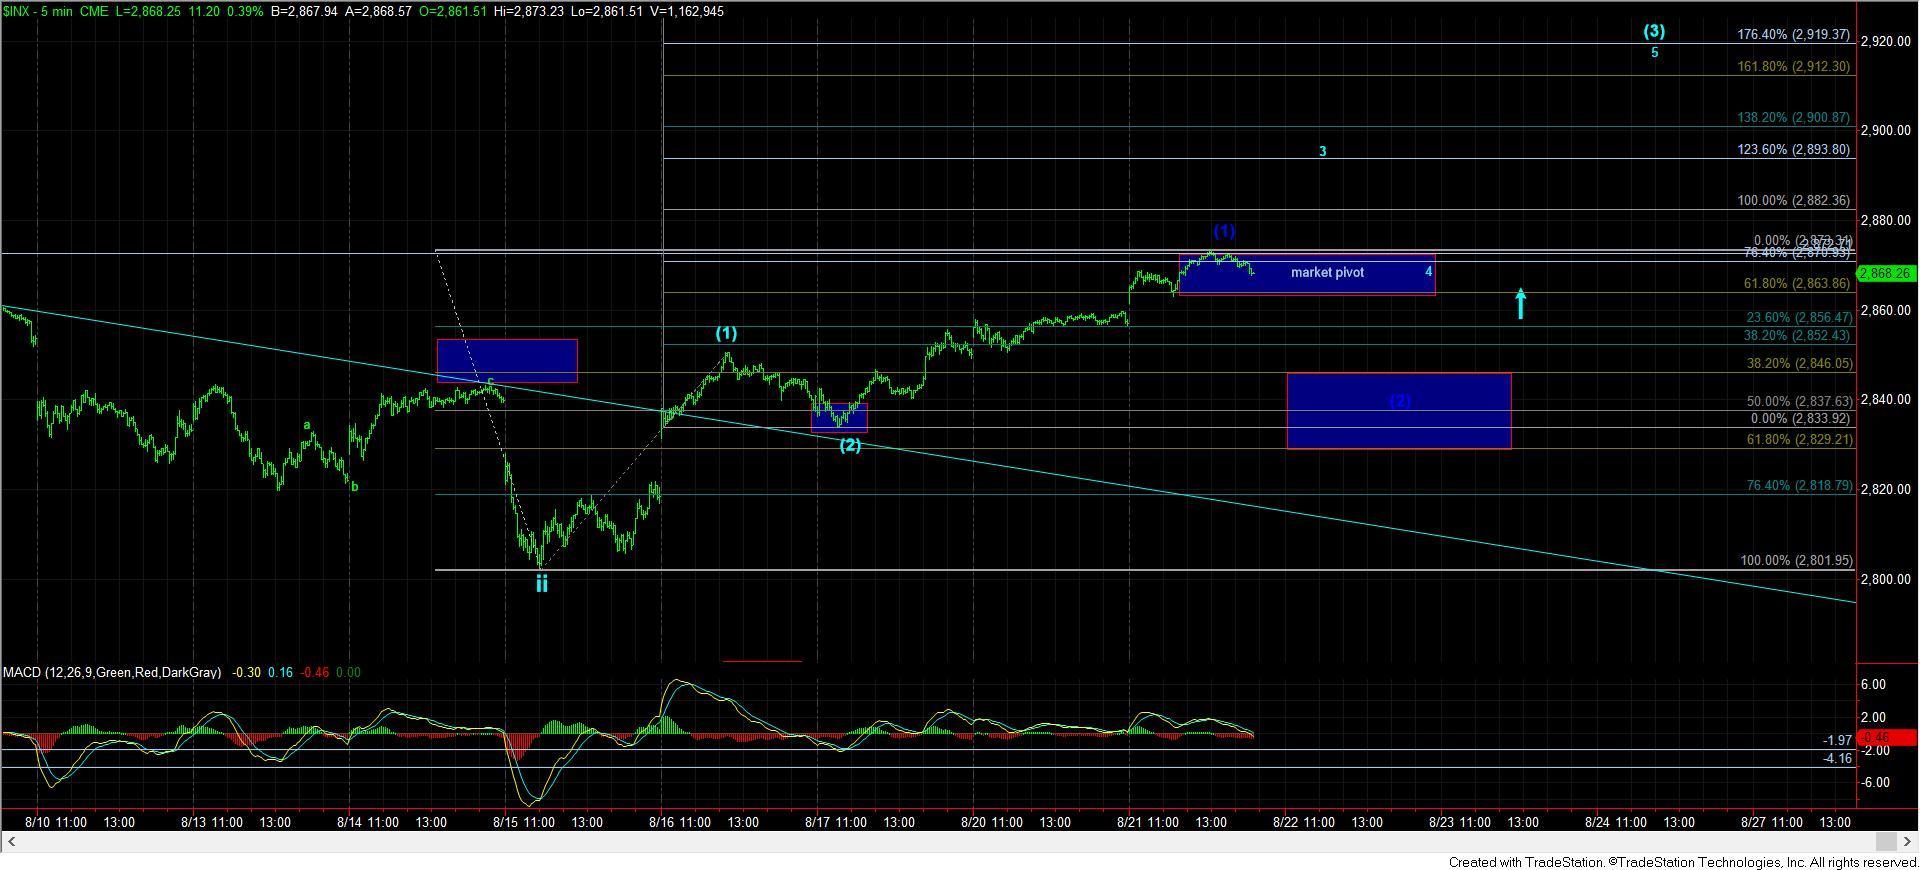
Now, in order for me to buy in to such an unusual potential, the market will have to break out through the .764 extension of that (1)(2) non-overlapping leading diagonal structure. Today, we walked right up to that line, and the market was unable to cross it . . . so far. This still leaves the door open to the potential that we just completed a much more extended 5th wave in wave (1), as presented in dark blue on the 5-minute chart.
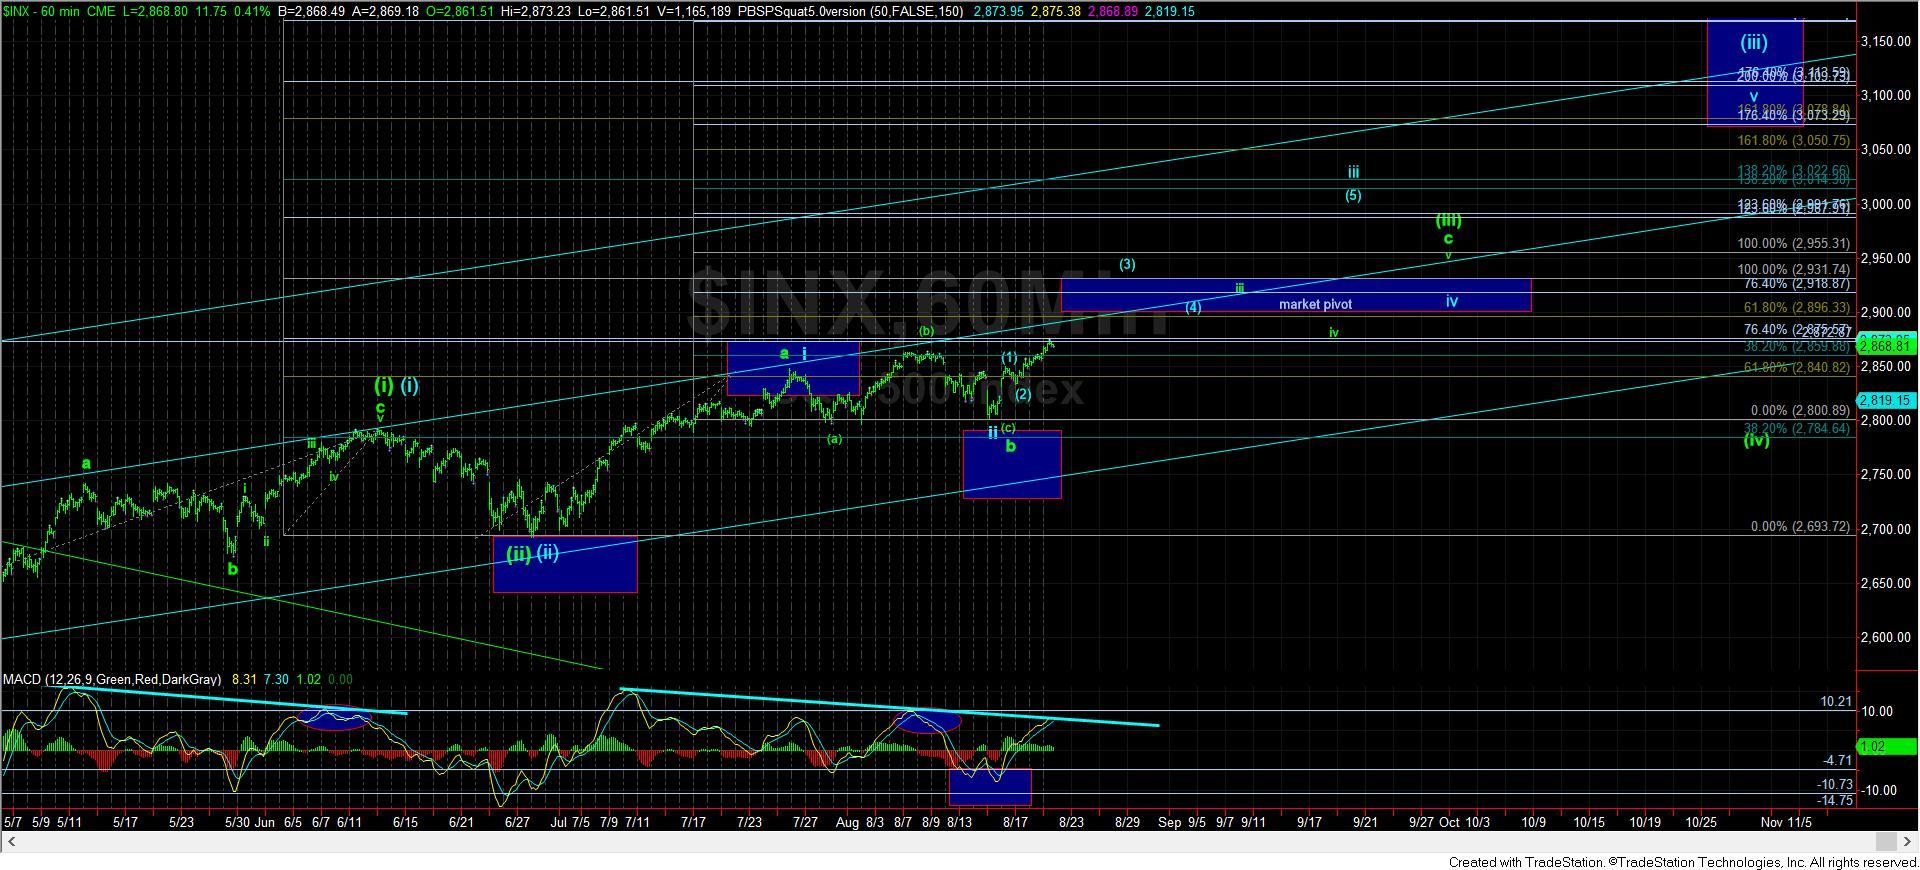
However, should the market be able to turn up strongly and take out that resistance, then we are likely targeting the 1.00-1.236 extension, and the .618 extension becomes support. Meaning, if we break out strongly over today’s high, 2863-2872SPX region becomes our support for a wave 4 pullback within wave (3) of iii of (iii). And, as long as we continue to hold the support we will continually raise throughout the Fibonacci Pinball structure as it moves higher, we will continue to point towards 3100+ to complete wave (iii) of (5), as shown on the 60-minute chart.
However, I would still “prefer” to see a much better and more reliable wave (2) pullback into later this week. And, should we see that pullback, this will likely be the last time you can board the train, as we prepare to break out to 2900+.
For now, the bull trend remains well intact as long as we hold over last week’s low, with the 2818-2845SPX being our main support below for wave (2).
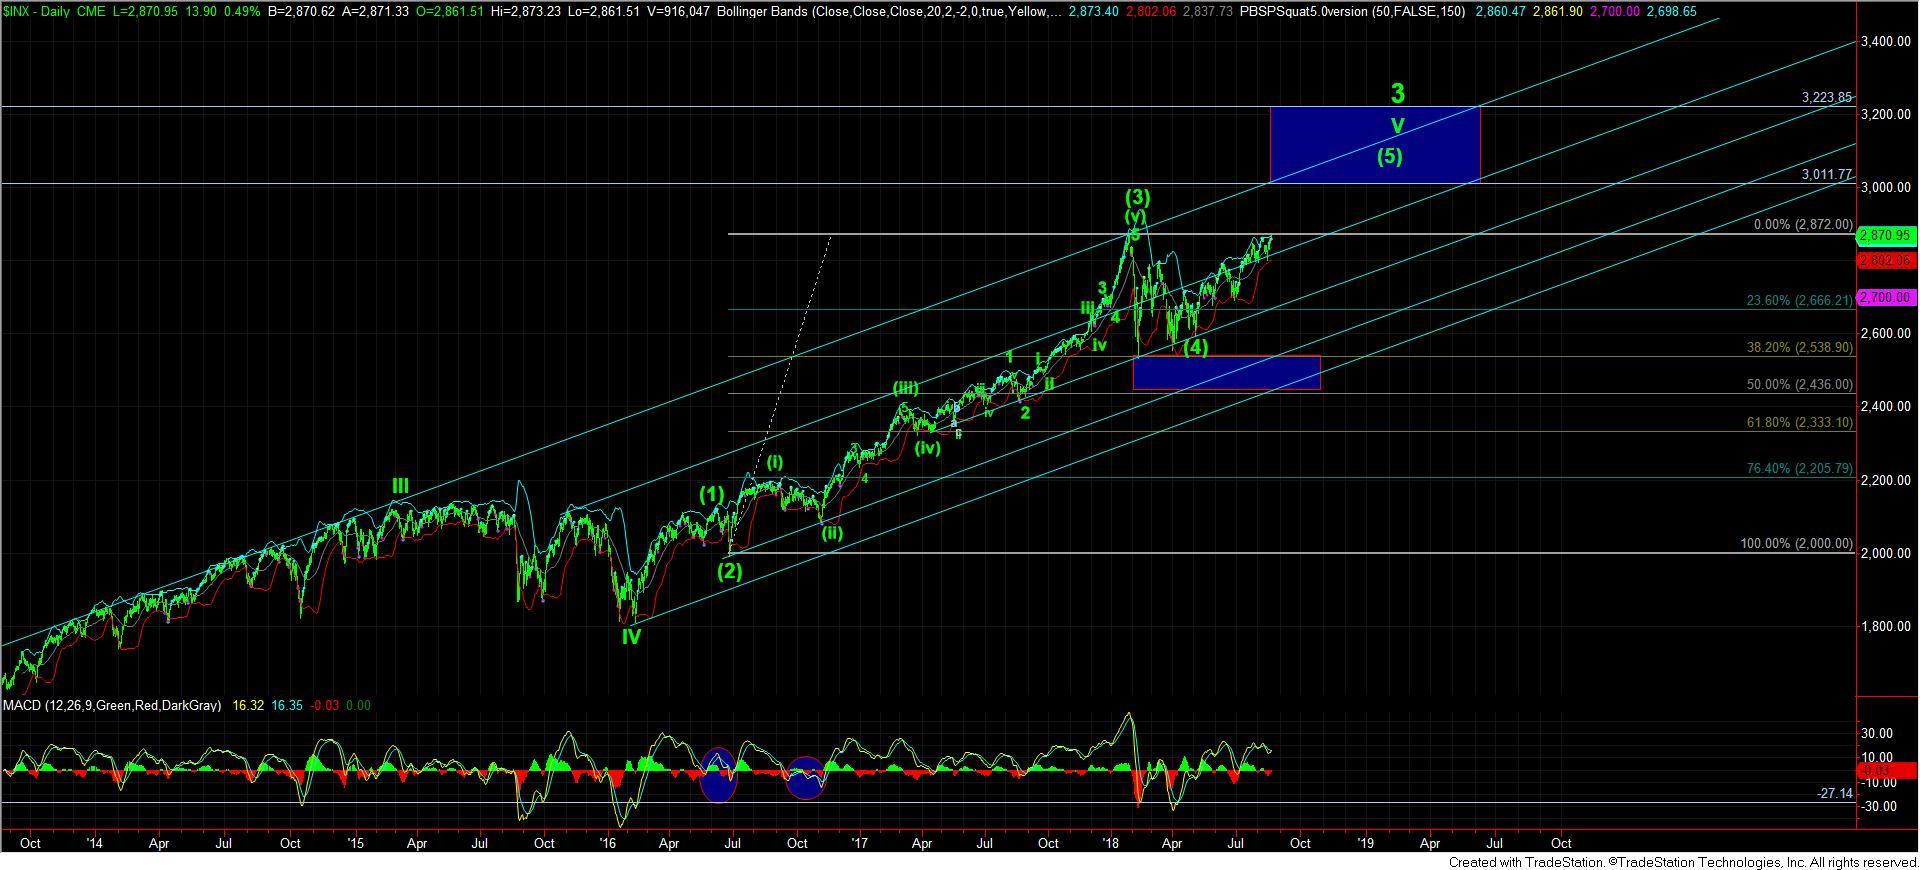
So, if we have a gap up tomorrow, then we will likely be in the heart of wave (3) of iii of (3), but if we continue to meander down overnight, then we will likely get another shot at a wave (2). And, since we are on the edge of the next major upside move, please consider where we are in the small degree versus where we are in the larger degree. Not all our long-term investors may even want the risk of the last 4-9% higher, as the market rally to complete wave (5) of v of 3 off the 2009 lows, and set up for what can be a 30% correction. Just consider how much risk you want to be taking for a final 5th in a multi-year trend. And, the higher we go, the more I will continue to focus on this issue.