We May Be Back On Track For The Bigger 4th Wave
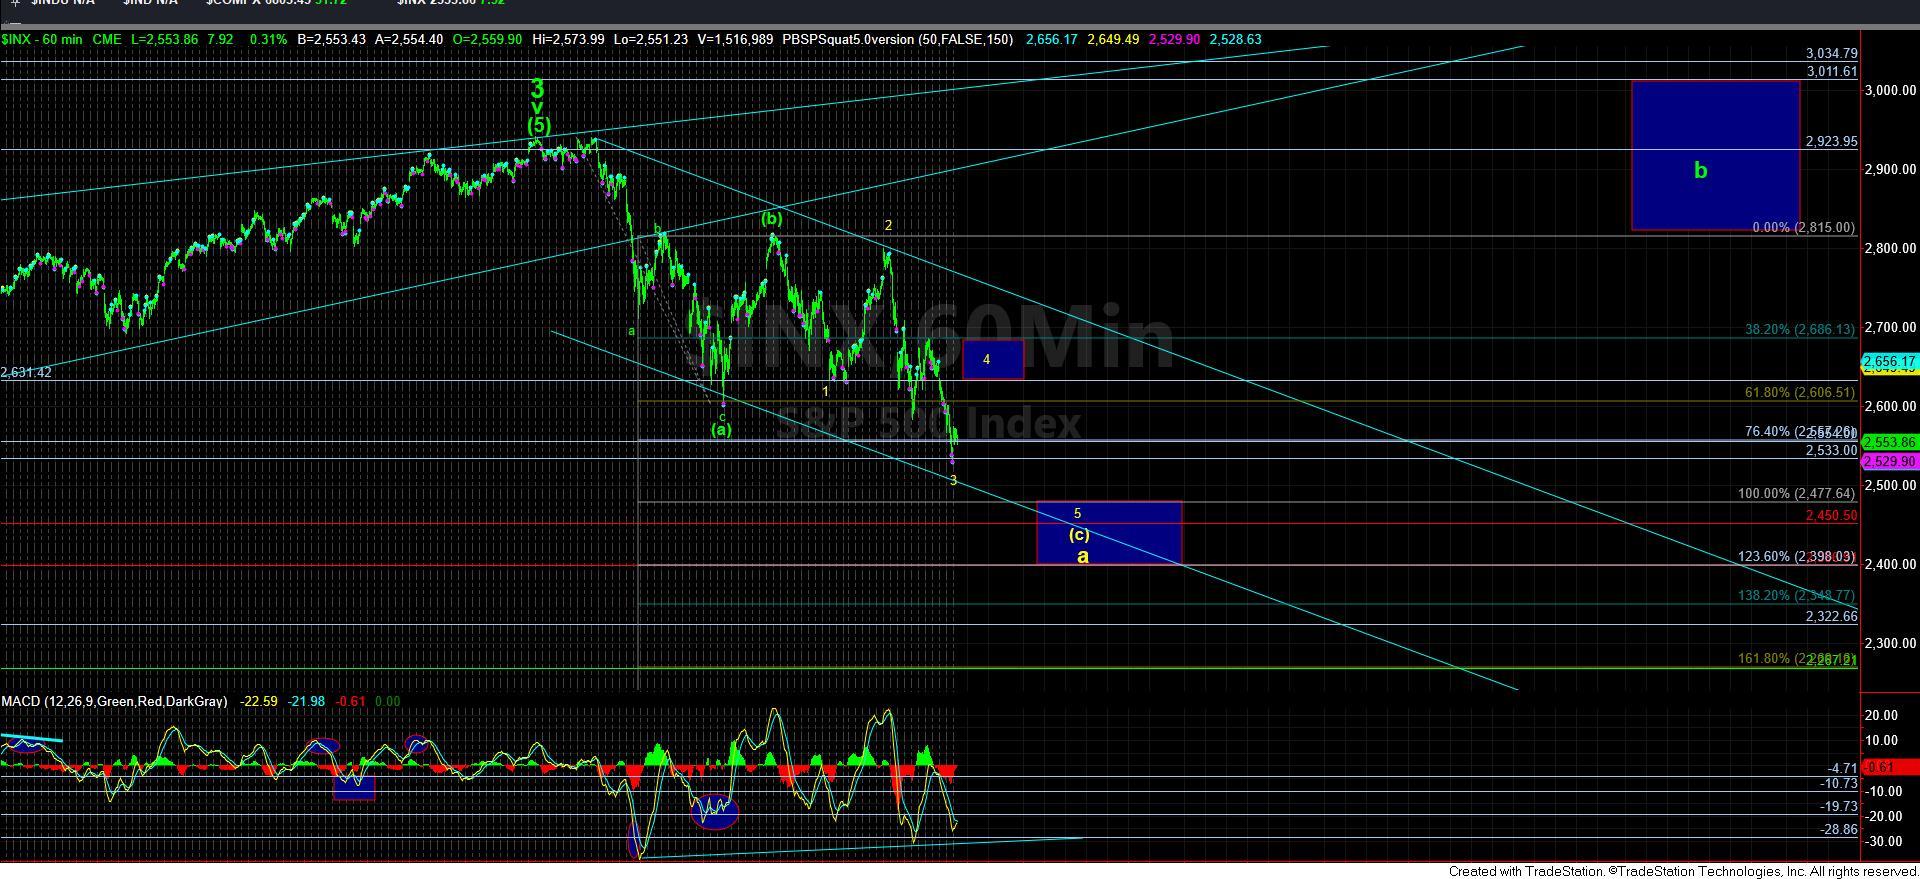
While the market did break down below 2550SPX yesterday, it was unable to follow through below 2530. In fact, it bottomed right there, and has begun what counts best as a corrective rally thus far.
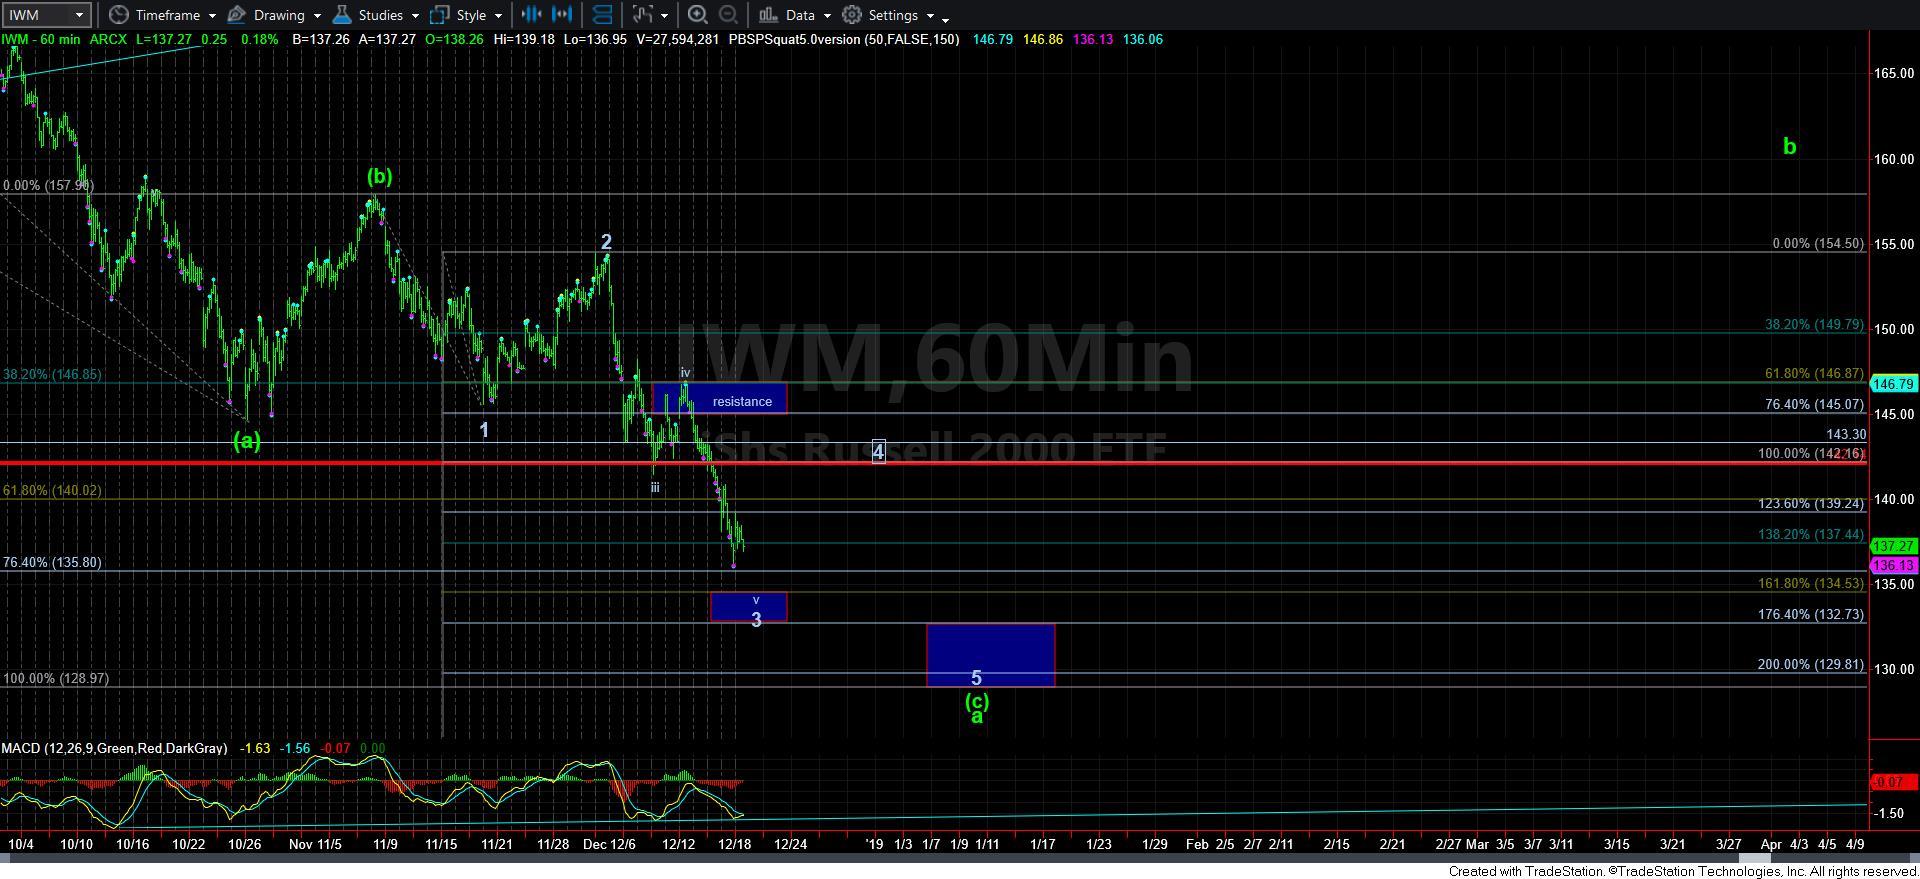
This has opened the door to another potential I am forced to track, which is best presented on the 60 minute IWM chart. As I noted last week, if the IWM was unable to break out through the 147 region (the .618 downside extension), then it opened the door to the (b) wave having completed, and it would likely be pointing down to the 130-33 region. This is pretty much what this chart is showing, especially after it topped at the .618 extension to the penny.
However, the more important perspective this now provides to me is that it seems we are completing 5 waves down in the (c) wave to the a-wave of wave 4. While it is not clear as to whether wave 3 down has yet completed, as the market has thus far bottomed in between the 1.382 and 1.618 extension, should we see a corrective rally back up to the 142-143.25 region, then we have an almost textbook Fibonacci Pinball 5 wave structure, which would still need a 5th wave lower to complete the (c) wave of the a-wave.
In addition to the structure being so well formed – assuming this continues to fill in as such – the 2.00 extension of waves 1 and 2 of this (c) wave points to just below the 130 region, which is also just above the (a)=(c) target off the all-time market highs in IWM. Again, it is this type of confluence that gives me more confidence in the potential that we are completing the a-wave, at least based upon this chart. And, of course, it also assumes that we do not see a break down below the 129 region in this set up. Should we break 129, then it would point to us dropping directly to complete this wave 4 sooner rather than later, as was discussed over the weekend regarding the SPX.
However, what this IWM pattern suggests is that the (c) wave of the a-wave in the SPX may be taking shape as another ending diagonal for the SPX. While we had to deal with the whipsaw of the ending diagonal in the c-wave of the (a) wave during the last half of October, we may have to deal with one again, depending upon the action we see in the coming week. So, while this has not yet been validated for me, I am putting you on notice of this potential which may be telegraphed by the IWM.
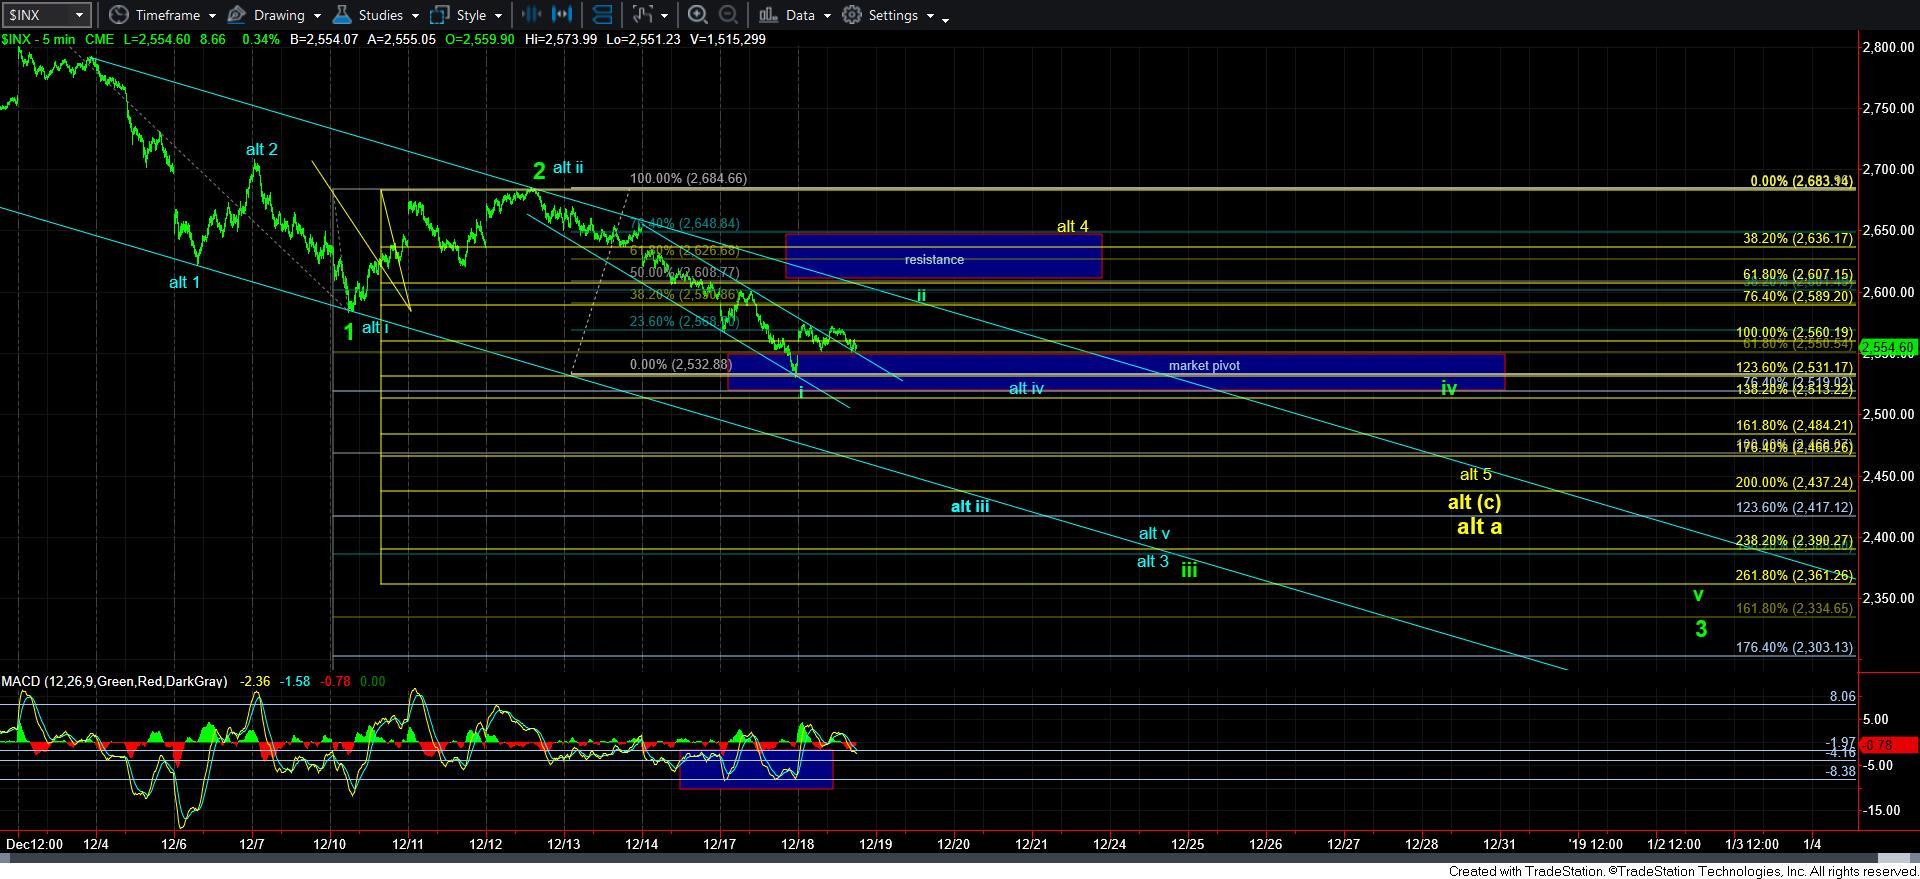
While my 5-minute SPX chart looks quite messy, and has several paths still being represented, I think the next day or two will provide us with a more narrow perspective. And, just as I outlined over the weekend the commonality between all the patterns we were following, the commonality between all these patterns is that I think we get a minimum drop to the 2477SPX region, which is the (a)=(c) off the highs, and with the ultimate support at 2400 for this pattern. This means that I do not think the downside has been completed. Moreover, should we break 2400, it would point us at least to the 2350 region below that (depending on how the pattern develops into the 2400 break down), with the strong potential to even drop as deep as the 2100-2200 region, as outlined over the weekend.
In conclusion, pressure still remains to the downside, and I still expect further weakness in the coming weeks, with the IWM providing me guidance again as to where we can look for bottoming in the coming weeks. If we hold the IWM pattern as presented, it would point us to seeing that multi-month b-wave rally we have been discussing for quite some time.