We Lost Our Perfect Figure
If you have been following closely, then you know we have been looking for a pullback in the market. And, ideally, that pullback would take shape as a 5-wave c-wave.
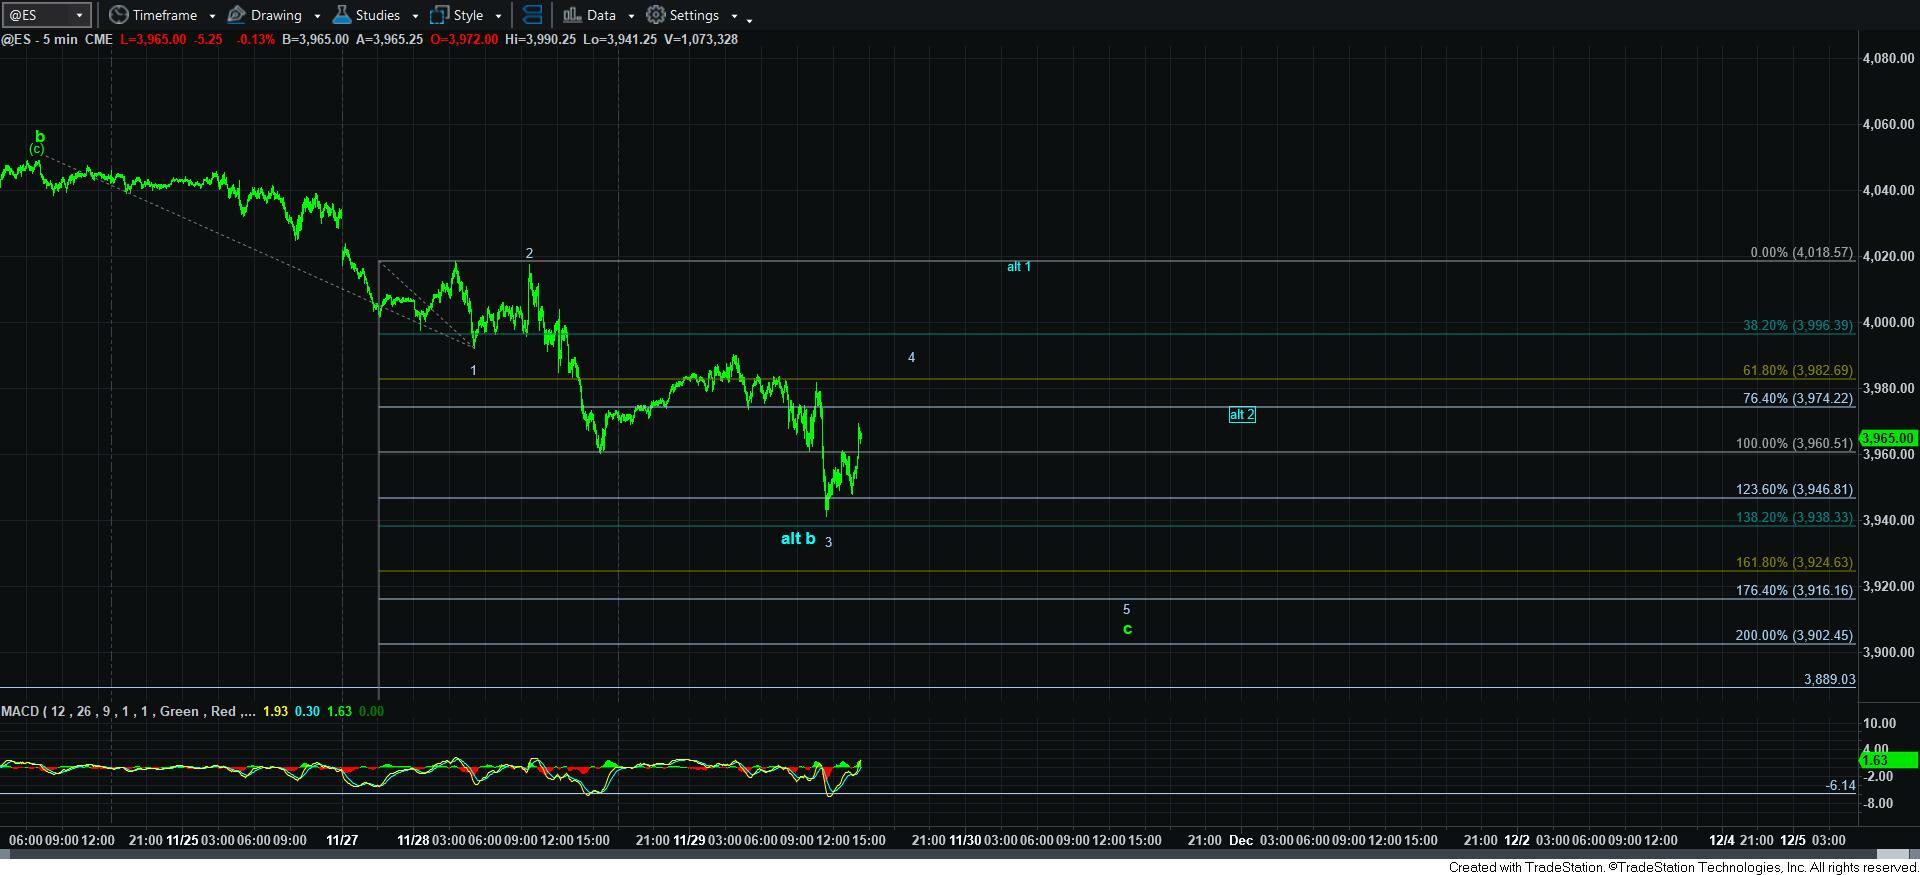
However, after the overnight action and today’s action, I cannot say we have a standard 5-wave downside structure developing. The best I can come up with is an ending diagonal for the c-wave, as outlined on the 5-minute ES chart.
Of course, the blue count is still alive, but we are getting a bit deep for a standard b-wave. So, I am giving the benefit of the doubt to the ending diagonal structure unless we see a 5-wave rally structure complete off a low for alt 1 in blue. Remember, c-waves typically are 5-wave structures, and if the blue b-wave has bottomed, then we should begin the c-wave in the blue count to 4118-4154SPX with a 5-wave initial rally structure for wave 1 of the c-wave. Thus far, we do not have that.
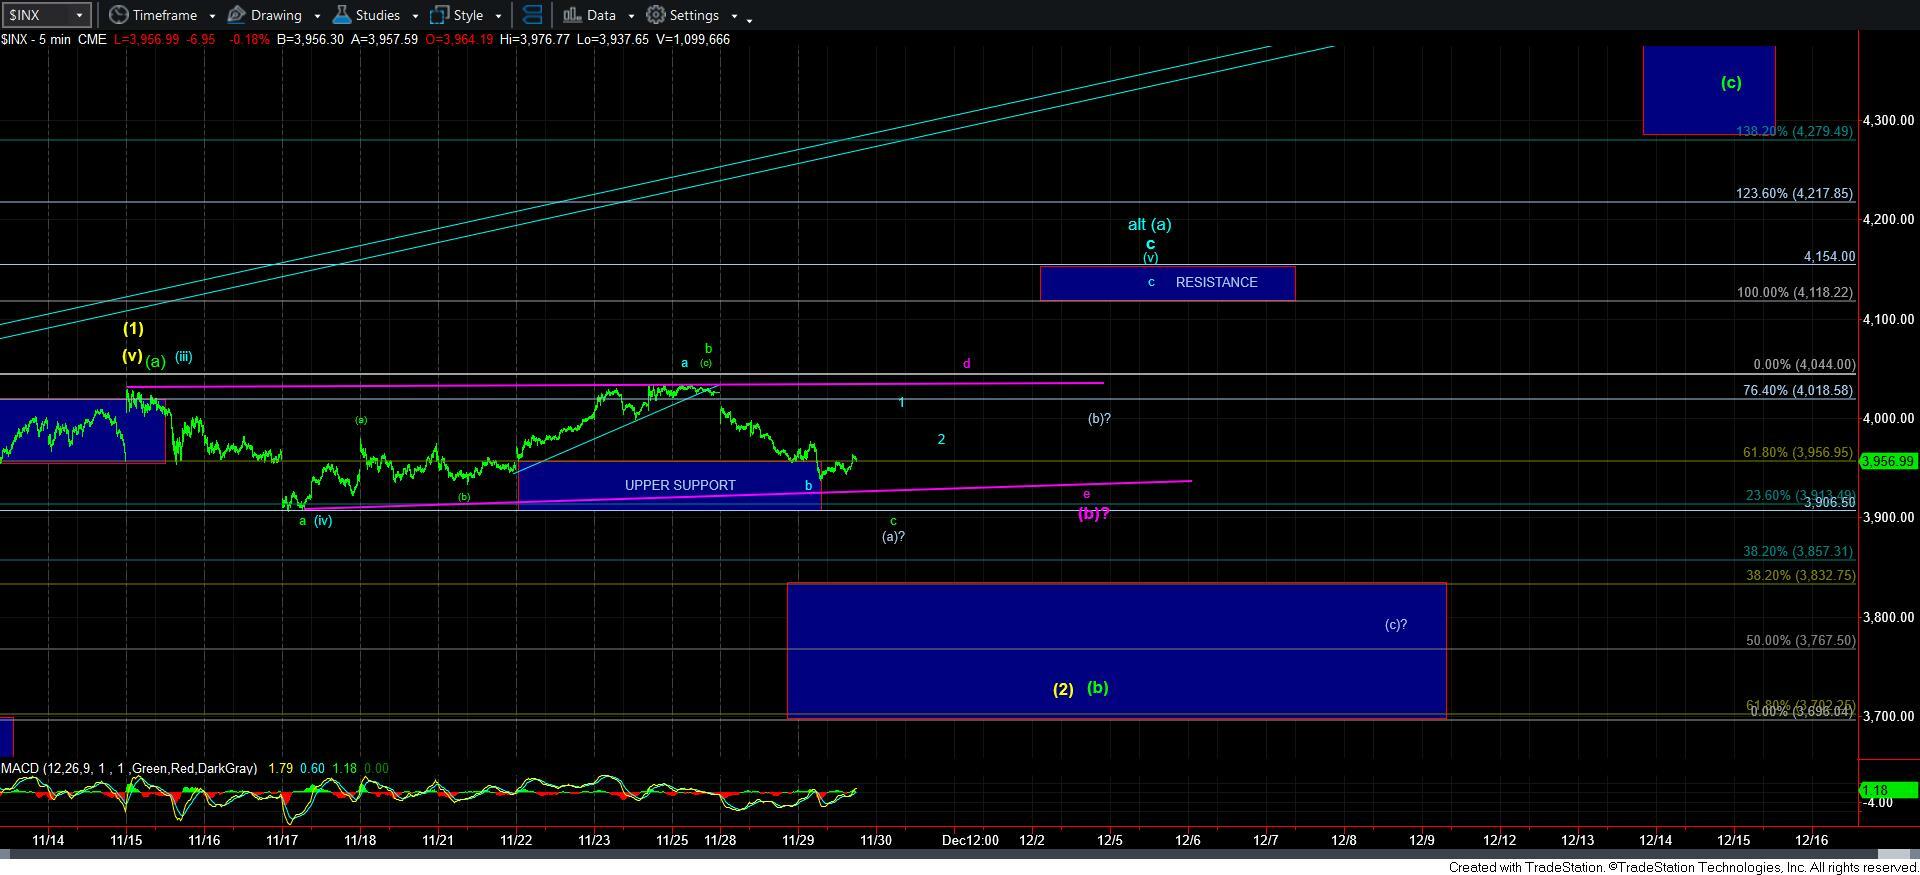
So, as it stands right now, there are still too many options for the market to take for me to comfortably place a high probability view on the micro count. In fact, I even noted earlier today that the larger [b] wave may even take shape as a triangle, as outlined on the 5-minute SPX chart in purple. But, as I also noted at the time, this is much less likely, but I wanted you to at least keep it in the back of your mind.
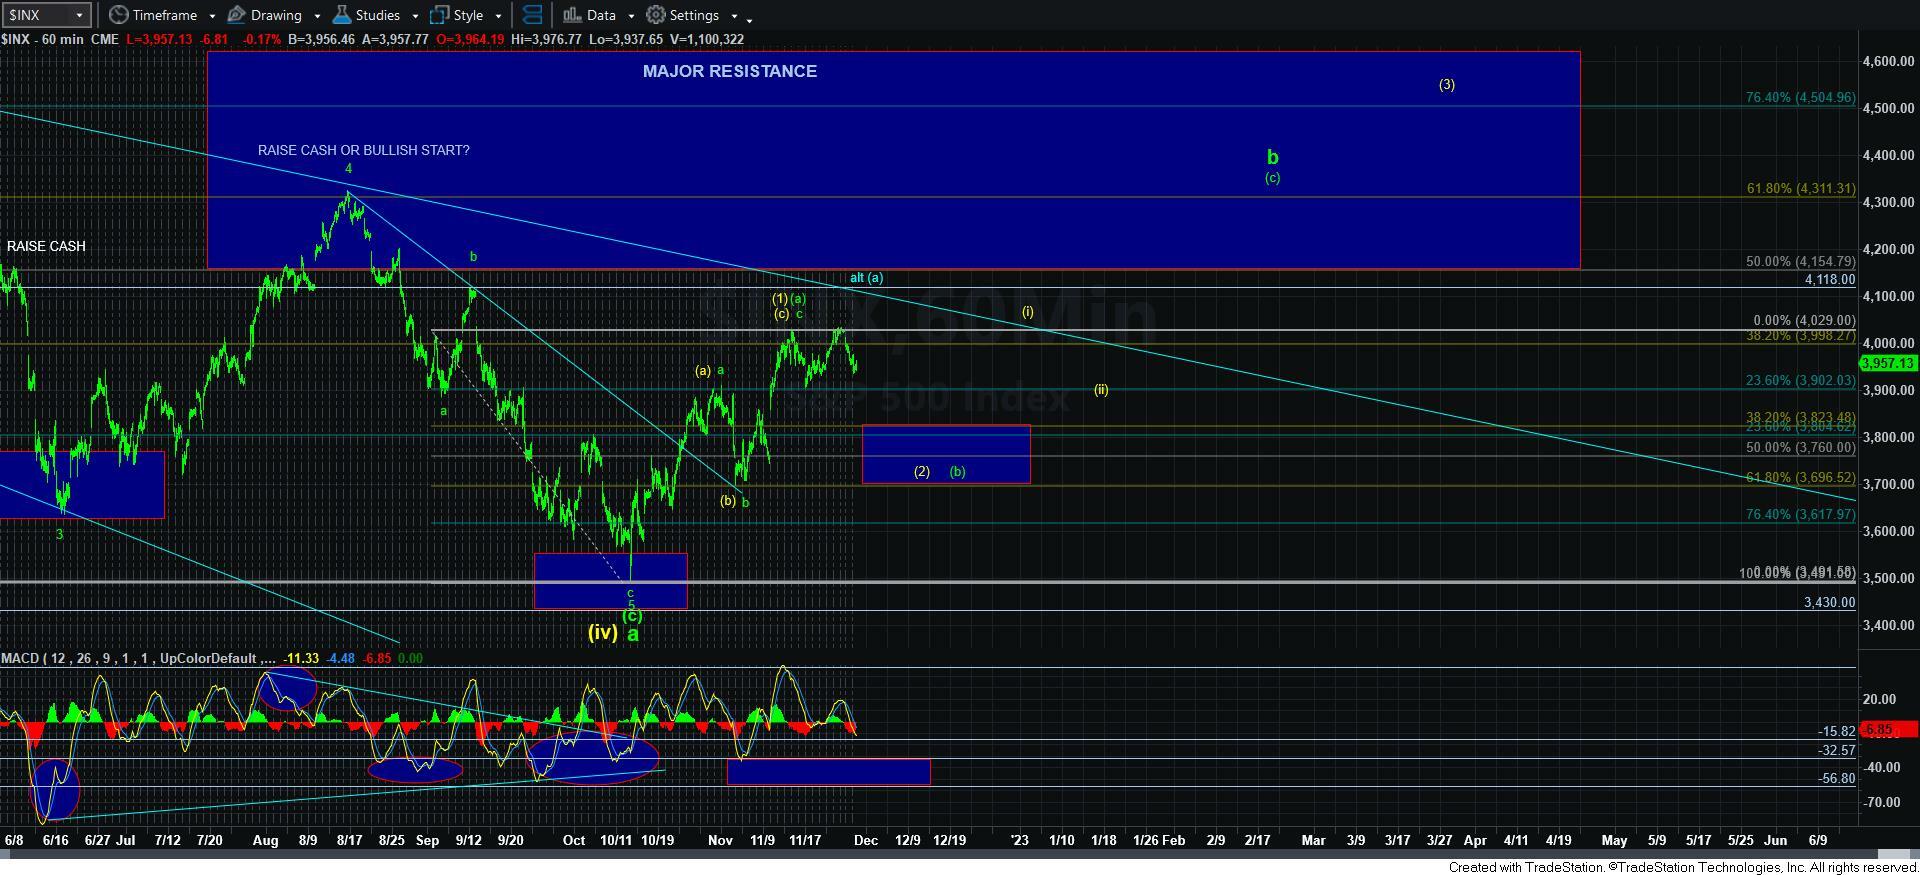
In the bigger picture, I still think we will be going to the 4118-4154SPX region, and potentially to at least the 4300SPX region. However, the market has yet provided us with the clear path to both. But, my preference remains to see a bigger pullback to reset the daily MACD.