We Just Got A Bit More Complex
So, normally, a 2nd wave takes shape as an a-b-c structure, wherein waves a and b are 3-wave structures, and c-waves are 5-wave structures. That is a straight forward corrective structure.
Yet, sometimes, the patterns do trace out something a bit more complex.
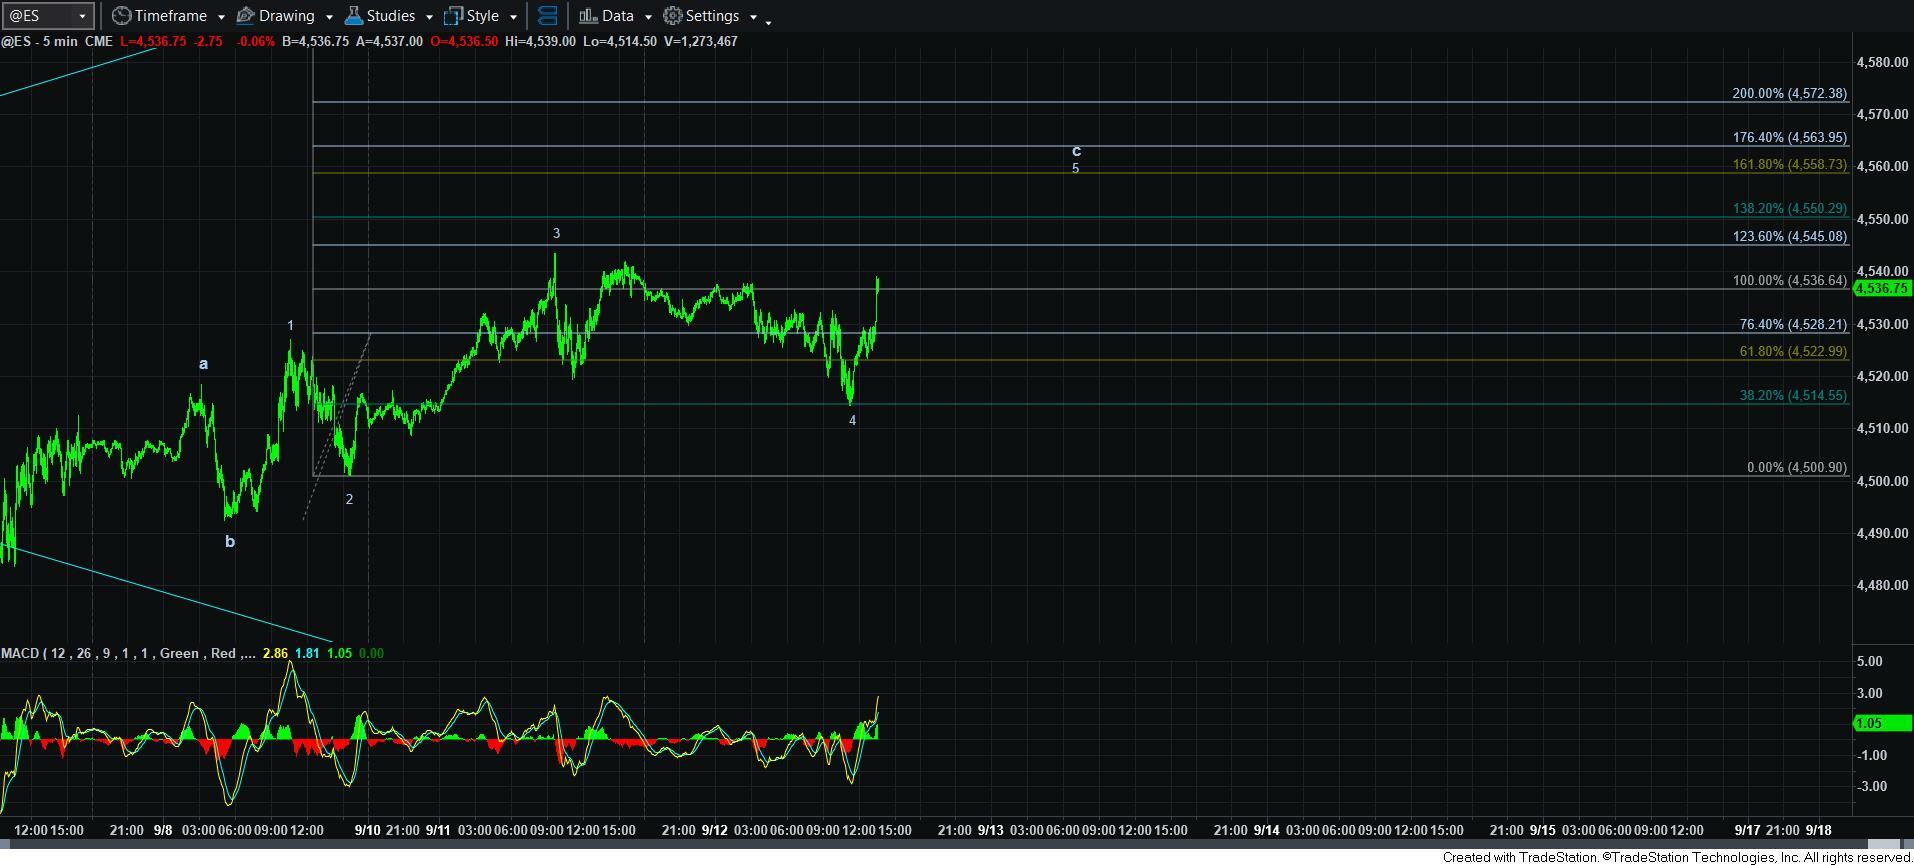
In the ES, I can count the structure as an a-b-c, but with the c-wave tracing out a potential ending diagonal, as outlined on the attached 5-minute ES chart.
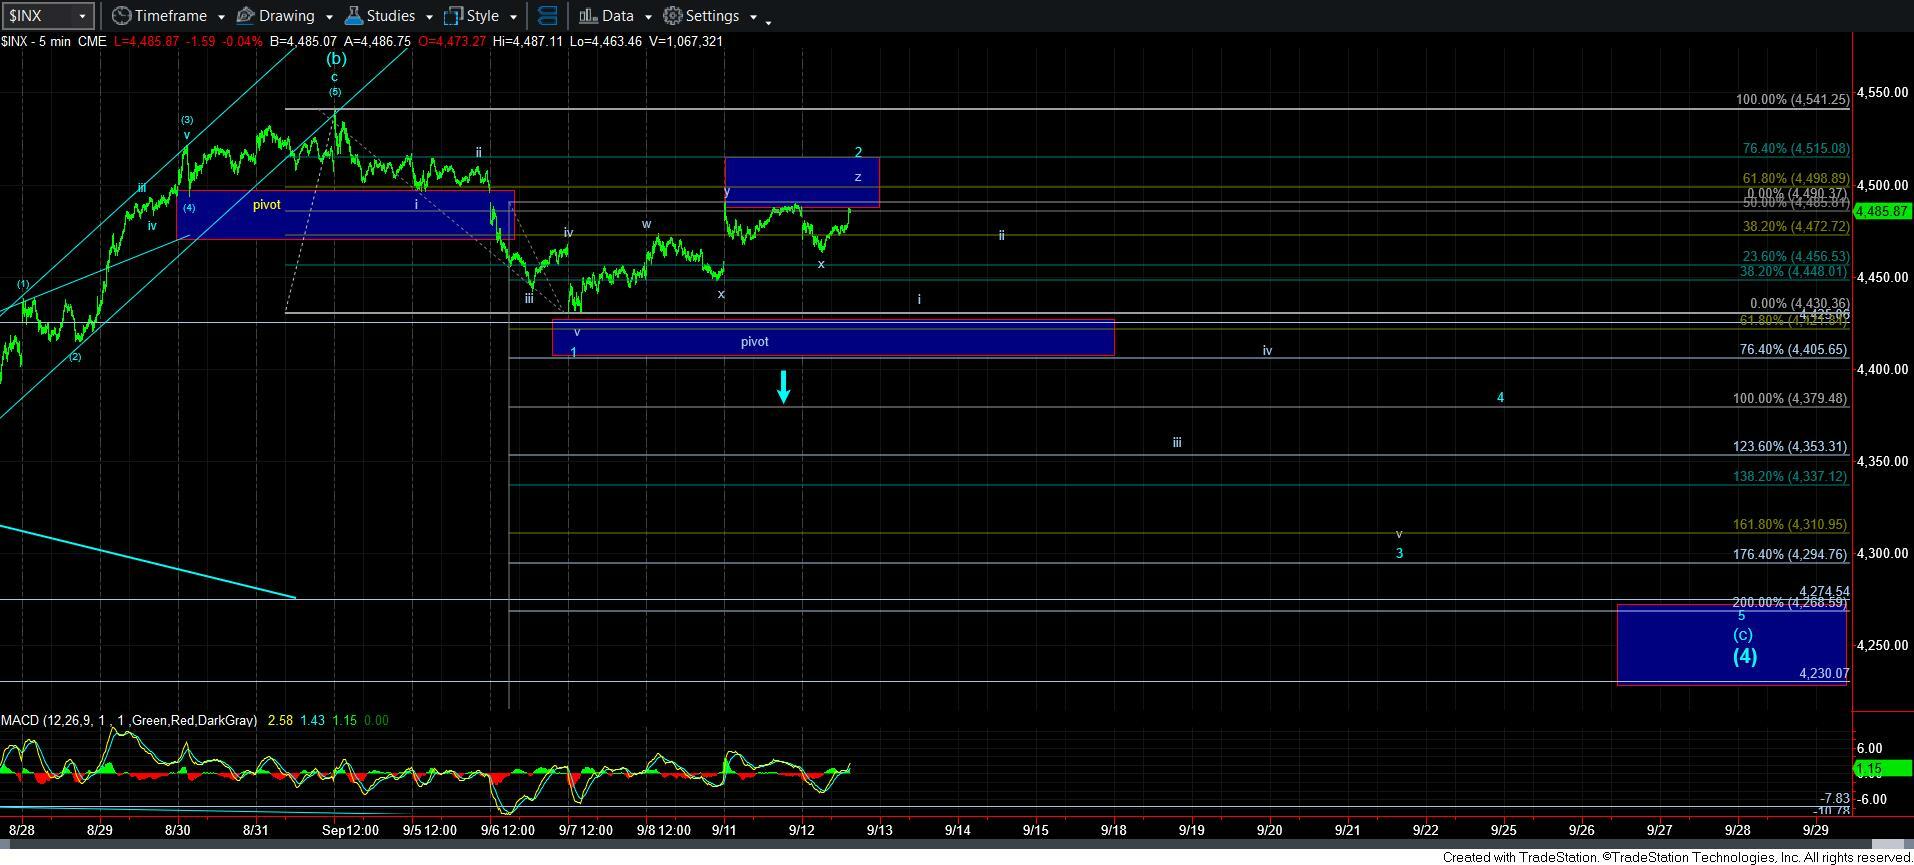
But, in the SPX, the most reasonable count is a relatively rare triple 3-wave structure, which is counted as w-x-y-x-z. And, that is what I now have on the 5-minute SPX chart.
Again, the safest and most reliable short set up would be to wait for another 5-wave decline to set up a 1-2, i-ii downside structure. Until that happens, we really do not have a higher probability downside expectation, other than the 1-2 now on the chart. And, as long as we remain below 4515SPX, this is going to be my expectation.
The other signal I am seeking is a break down below 4430, with follow through below 4400. That would then make 4430SPX resistance, and our target being set as the blue box on the lower right side of the 5-minute SPX chart.
And, should the market push a bit higher towards the ideal 4499SPX target, then I will have to slightly adjust the Fibonacci Pinball projections (along with the pivot) just a bit higher.