We Have Hit Our Target
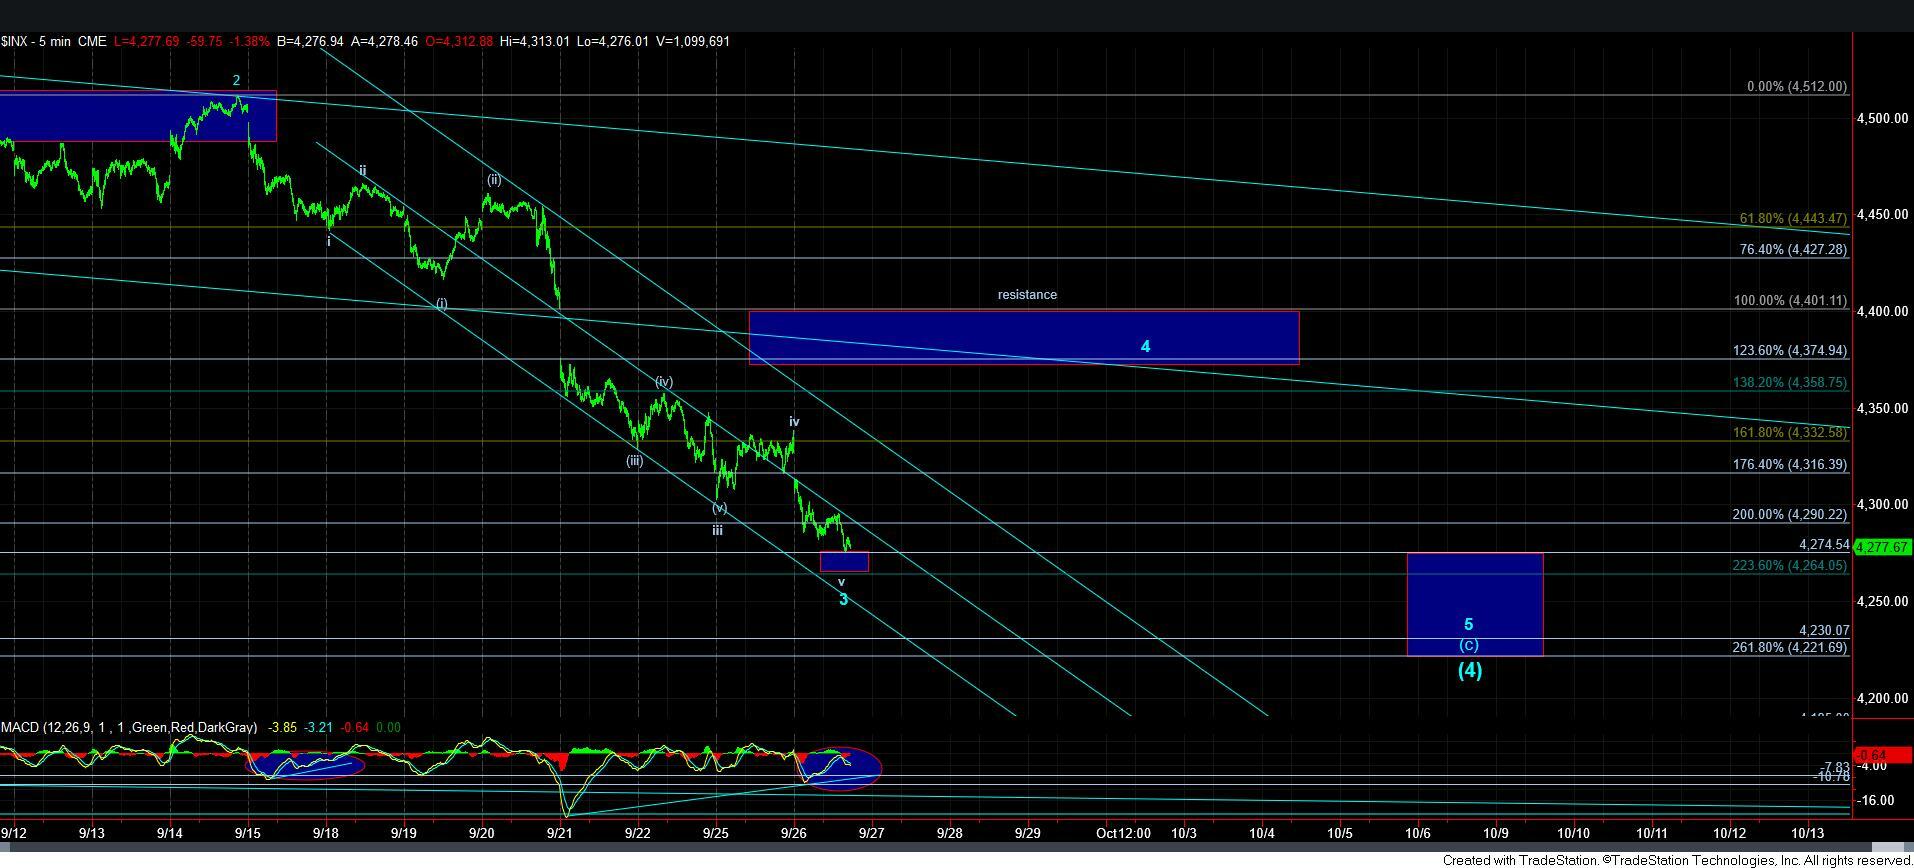
As I write this update, we have struck a low of 4276SPX, which is effectively striking the top of the target/support we set before this decline began in earnest. While I wanted to see the 4274SPX level hold as my primary target, I still do not feel comfortable in viewing a full 5-wave decline as having completed in this potential [c] wave decline. Rather, I still am looking for another 4-5 to complete this [c] wave. Therefore, that would suggest we have a strong probability of getting a bit lower.
Now, in order for me to remain confident in this structure, I am going to want to see the top of our support/target of 4230-4274SPX hold as support for wave 3. This gives us enough room lower for the potential wave 5 that I would still ideally like to see fill in this 5-wave [c] wave structure. Therefore, I would prefer to see a corrective rally take us back over 4300SPX to provide an initial signal that wave 4 has indeed begun.
You see, if we continue to drop in just wave 3 alone, then it begins to concern me a bit more regarding the green count, as I outlined over the weekend. For now, I think we are following through rather well for the blue count. But, clearly, I want to see wave 4 begin very soon to keep this as a strong primary wave count.
The ideal target for wave 4 right now is the big blue box noted on the 5-minute SPX. But, I also want to add that the .382 retracement of wave 3 (the typical target for wave 4) is just below that box. Once we have a confirmed bottom in place, I will add that to the analysis, and likely lower the box ever so slightly.
Another point I would like to add is that Luke Miller, who runs our Bayesian service at Elliottwavetrader.net has calculated the probability of the green count at 23%. That would suggest that it is to be considered a lower-level probability, which is how I am viewing it currently. But, again, for me to remain comfortable with this potential, I would really want to see a “bounce” begin pretty soon.
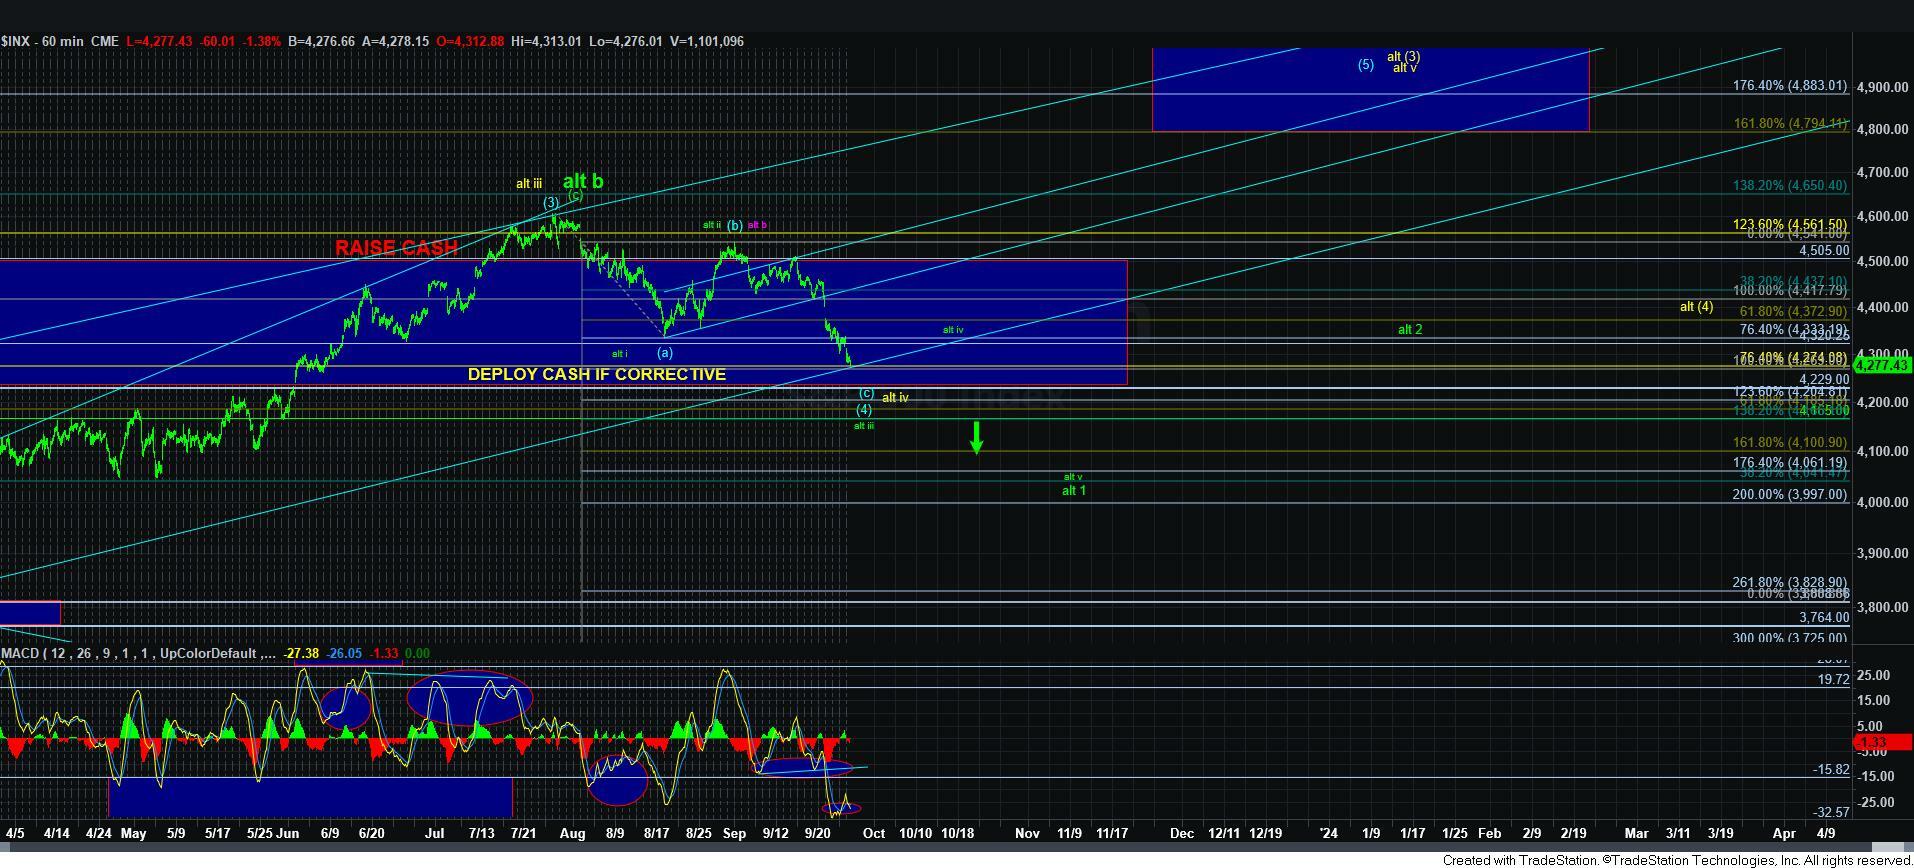
Furthermore, we are seeing positive divergences across many time frames. In fact, if you look at the 60-minute chart, the divergence we are seeing in the MACD is strongly indicative of a bottoming structure. So, this does add to the support for the blue count. But, again, it would be quite helpful to begin a bounce soon.
Now, the question many of you are asking is whether this is a good time to re-deploy the money I suggested you raise several months ago as we were approaching the summer high. And, it is not an easy answer.
You see, much of the answer is based upon your own risk tolerance. Normally, I would begin buying at the bottom of what I view as the 3rd wave of a [c] wave. That is generally where we reside right now. However, due to the unusual nature of the market structure over the last year and half, I would personally want more assurance. Therefore, I would prefer to wait for the 4-5 to complete, or for the market to take us back over the 4401SPX resistance region.
Yet, there are many of you that are much more risk-tolerant than I. Therefore, you can always choose to begin layering into positions. But, please keep in mind your risk management throughout your entire plan. I really would not want to see the market breaking down below the 4165SPX region, as I outlined in the weekend update.
So, in summary, we are now at a point where it would be reasonable to begin to expect a 4th wave bounce take us back to the resistance region noted on the 5-minute SPX chart. But, in my humble opinion, I personally would like to see evidence of that bounce before I would be wholly confident in this structure holding, as per the Bayesian probabilities currently suggest.