We Got Our Curve-ball
As I said the other day, the market was almost too easy in its turns up and down over the last few weeks. That is why I said to prepare for a curve ball. And, the curve-ball seems to be setting up as a direct move to our resistance overhead.
When we were near the lows of 2600SPX, and we were presenting the 2011 fractal as a potential way for the market to set up a “crash-like” event to 2200SPX, many were questioning how the market was going to set up to turn so bullish as to be able to support such a drop. Well, after this move, many will not likely be questioning it anymore, and will likely be certain that new all-time highs are coming.
But, to be honest, this would be the perfect set up for that brutal c-wave down, similar to what was seen in 2011.
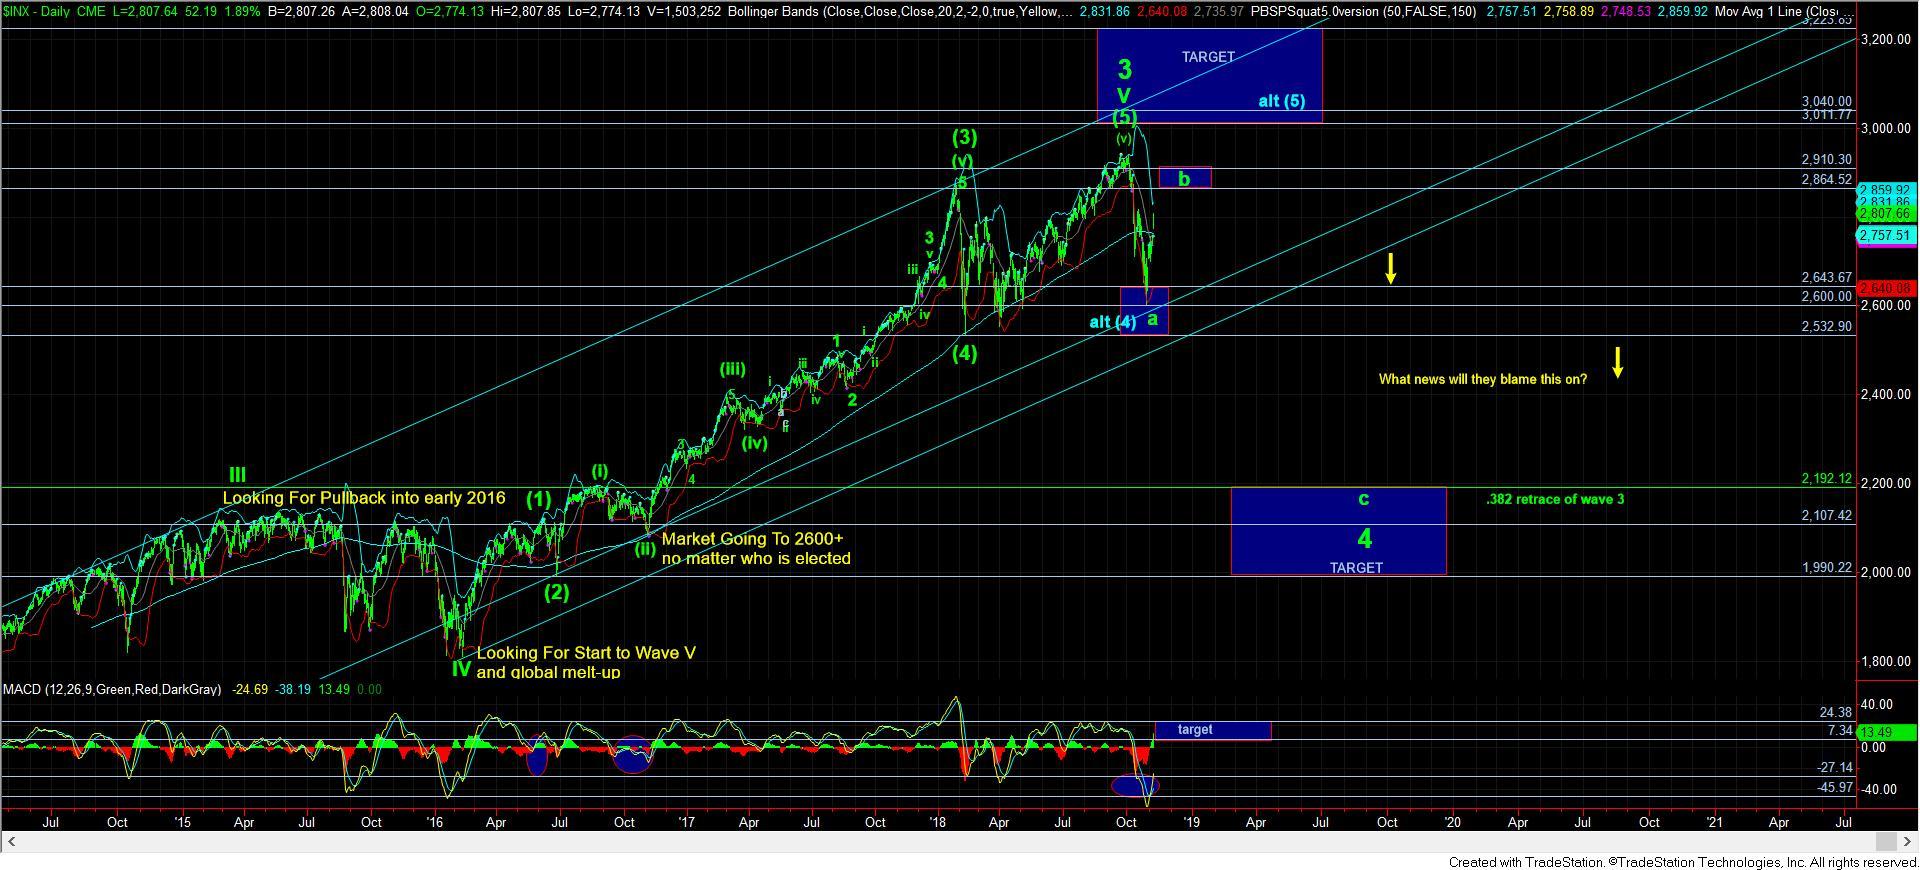
However, there is one issue which is giving me pause about that potential. You see, the MACD on the daily charts do not seem to have risen enough to substantiate such a c-wave lower. While it is certainly not required to see the MACD climb to our ideal target, it would have been nice if that fell into place in addition to all the other indications.
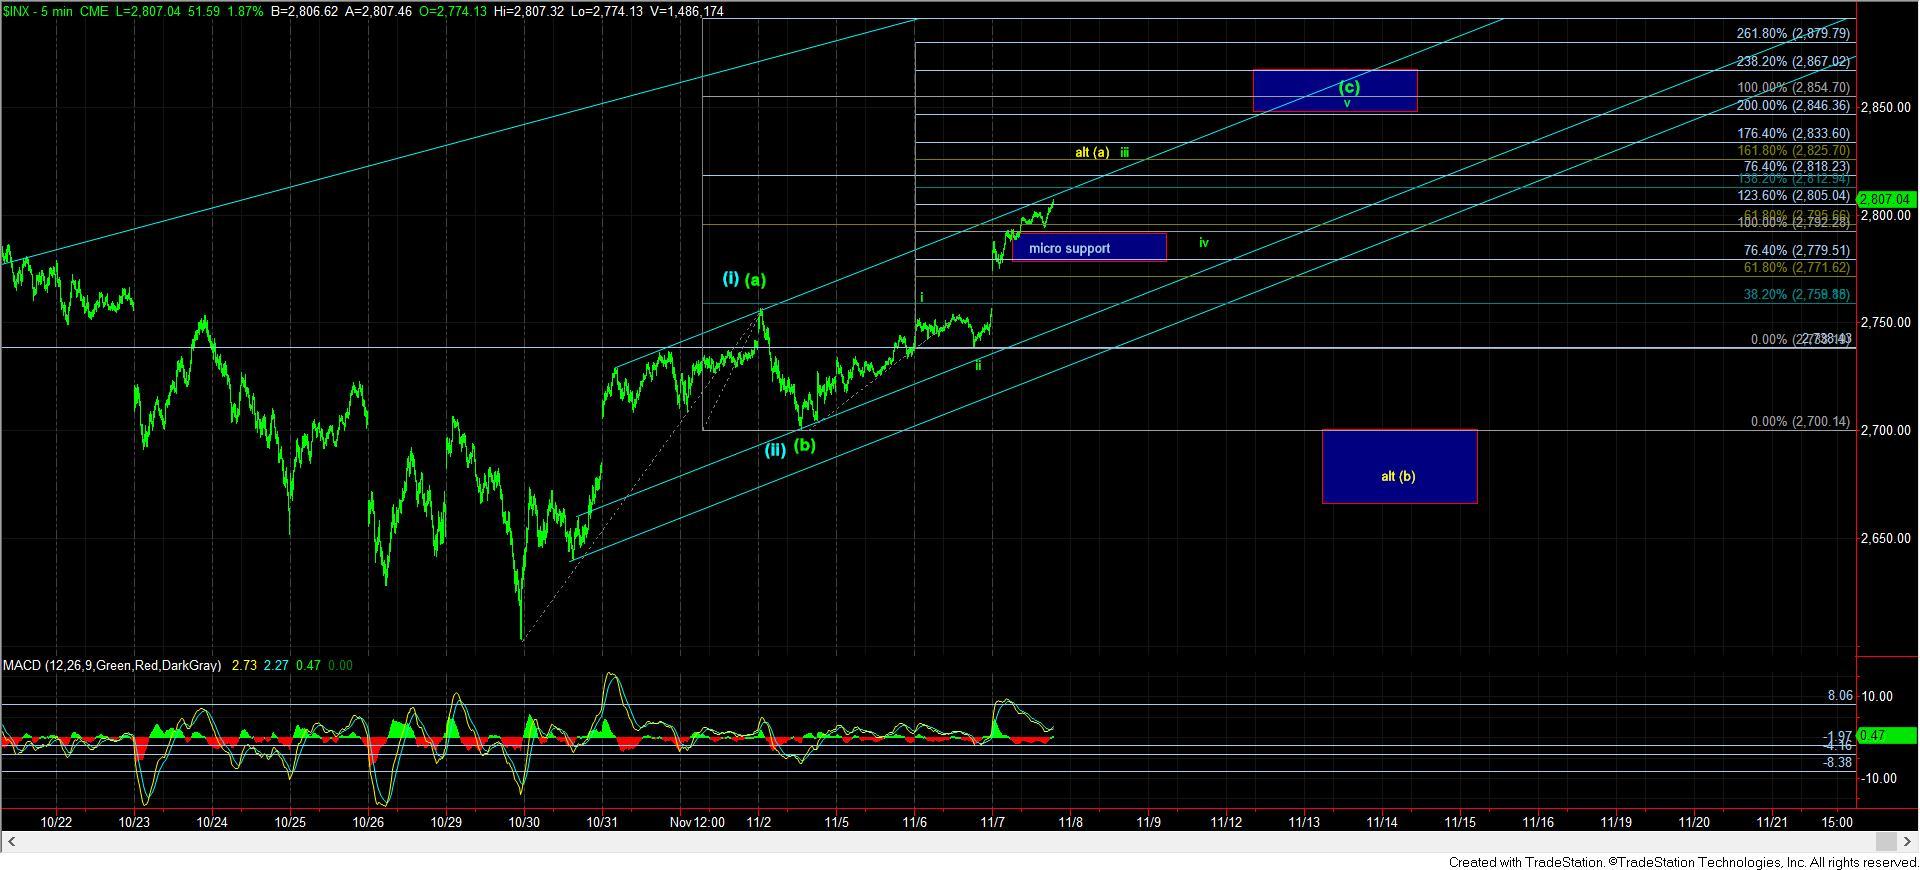
Putting that aside, the market seems to be targeting the 2850-60SPX region in a direct fashion, as long as we do not break back below 2779SPX. And, should we head higher to our fractal target in a direct fashion, then we have to be on the lookout for an impulsive drop from that region, which would provide us with wave 1 down in the c-wave, similar to what was seen in 2011. Moreover, an impulsive break down below 2795SPX from the 2850SPX region would provide us with a very strong indication that the c-wave down is likely taking hold.
I also want to note that the direct path to our fractal target box was not my primary expectation because it is not the standard manner in which these moves take shape. Even the 2011 fractal provided us with a standard-type of pullback before the strong move higher into the topping zone took shape. But, sometimes the market provides us with the lower probability path, and this may be one of those times, especially after we had a several week string of an almost perfectly acting market.
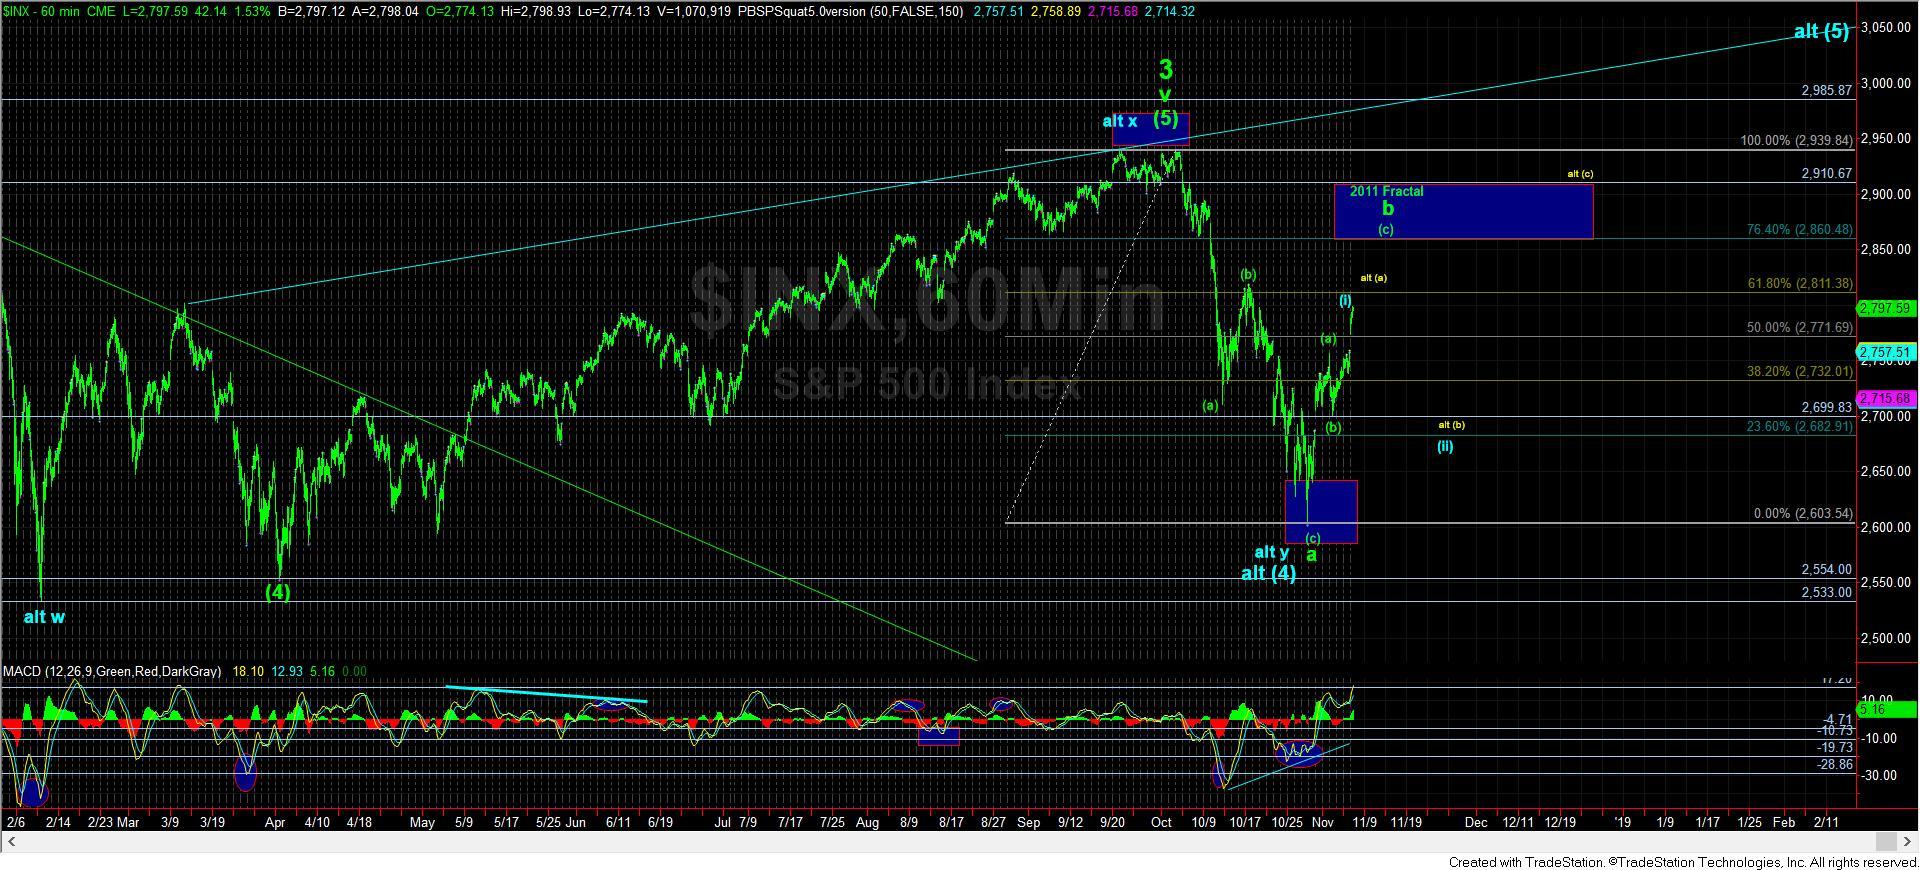
The alternatives I will be watching are presented in yellow or blue. The yellow count would only take hold if we were to break below the 2779SPX level, with follow through below 2770SPX. In this pattern, we would be following the inverse heads and shoulders pattern that many in the market are tracking. The common thought about this is that we will top out near the (b) wave high in the green a-wave drop, which is seen to the left of the high we are now hitting on this rally on the 60-minute chart. This topping region also coincides with the current location of the upper Bollinger Band on the daily chart. Most expect us to drop back down to the 2700SPX region from this topping region, which is then projected to take us to new all-time highs by the followers of this pattern.
However, my expectation would be that we would hold the 2700SPX region, and then rally to the 2910SPX region in an (a)(b)(c) structure, and then turn down hard rather than extending to new all-time highs pursuant to the common expectation. But, again, this must break below 2779SPX to even begin to enter consideration.
The least likely alternative to me now is the blue count to new all-time highs. It is presented in blue and has us within wave iii of (iii) in blue, which ultimately points to the 3011 region to complete all of wave (5) in blue. As I said, this to me seems the lesser likely potential for now. But, if the market does reach the 2850SPX region, and only pulls back correctively to the 2795SPX region, then I may adopt this count. But, due to the potential fractal pattern from 2011, I have to watch how we drop off that 2850SPX region, because if it is clearly impulsive to the downside, it can be quite devastating to long positions.
So, as long as we hold over 2779SPX now, it seems the market is directly targeting the 2850-60SPX region, in what I am counting as the (c) wave of the b-wave in the 2011 fractal pattern. We would need to see an impulsive decline from that resistance box to signal the start of the major c-wave down, with the impulsive break down below 2795 from 2850 being a strong indication the c-wave decline has begun in earnest.
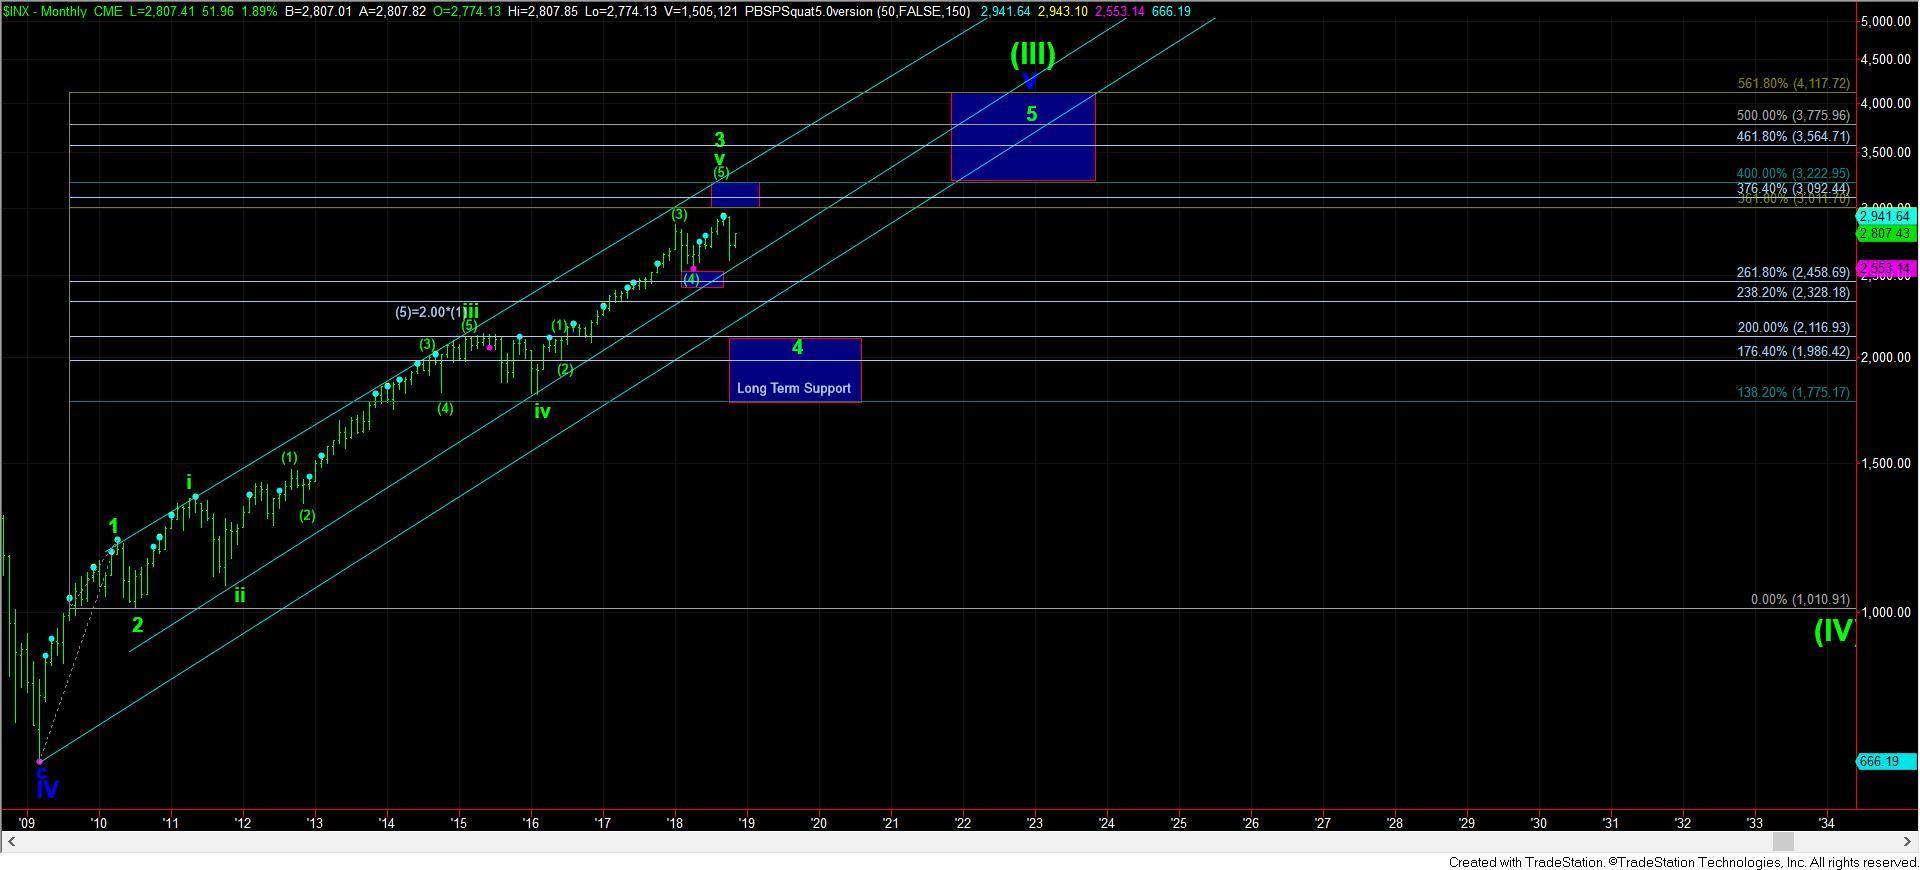
One way or another, wave 4 will likely be targeting the 2200SPX region. What we are attempting to glean is if we are setting up for that drop sooner rather than later. But, probabilities suggest we will revisit that region in wave 4 before we see the final rally of wave 5 off the 2009 lows, as presented on the monthly chart.