We Certainly Got A “Bounce” Today
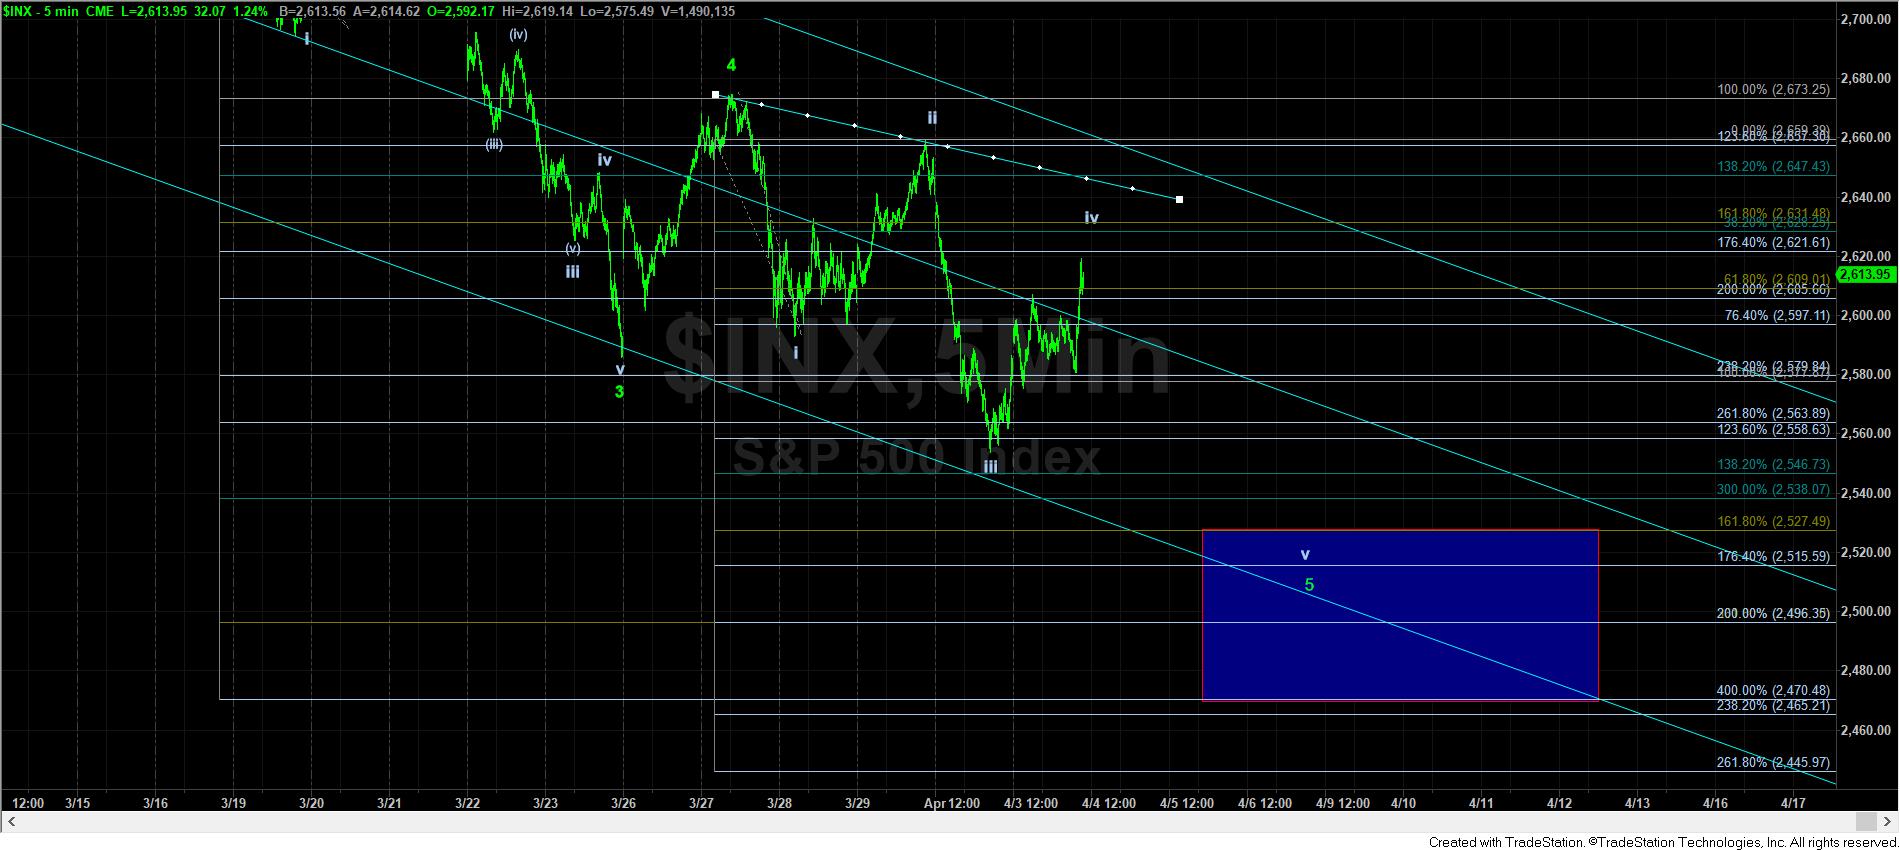
As you saw from the charts I provided you yesterday afternoon, the market was likely set up to bounce today for a 4th wave, and the ideal target was the 2596SPX region. And, we certainly got that bounce.
Our 3rd wave struck the 1.236 extension, so we expected that we should see a bounce in a 4th wave to the .764 extension at 2596/97SPX. However, as our Fibonacci Pinball method warns, if we bounce higher than the .764 in such a set-up, we have an early warning signal that the market may not be continuing down in the standard impulsive structure. And, when we exceed the .618 extension (2609), it confirms that for us.
So, it leaves me questioning what the structure is that struck the 1.236 extension off the highs, and the most common answer to that question in this case would be an ending diagonal structure in this 5th wave of the c-wave. In fact, the 3rd wave of an ending diagonal often strikes the 1.236 extension before it breaks out over the .618. It also would explain the significant volatility we have been seeing of late.
But, one cannot be certain that this is what we are dealing until we see that break out over the .618 extension. In fact, when you have a standard impulsive structure, you continue to follow it until the warning signs appear . . . such as breaking out over the .764 extension from the 1.236 extension. And, I was alluding to this today in my updates.
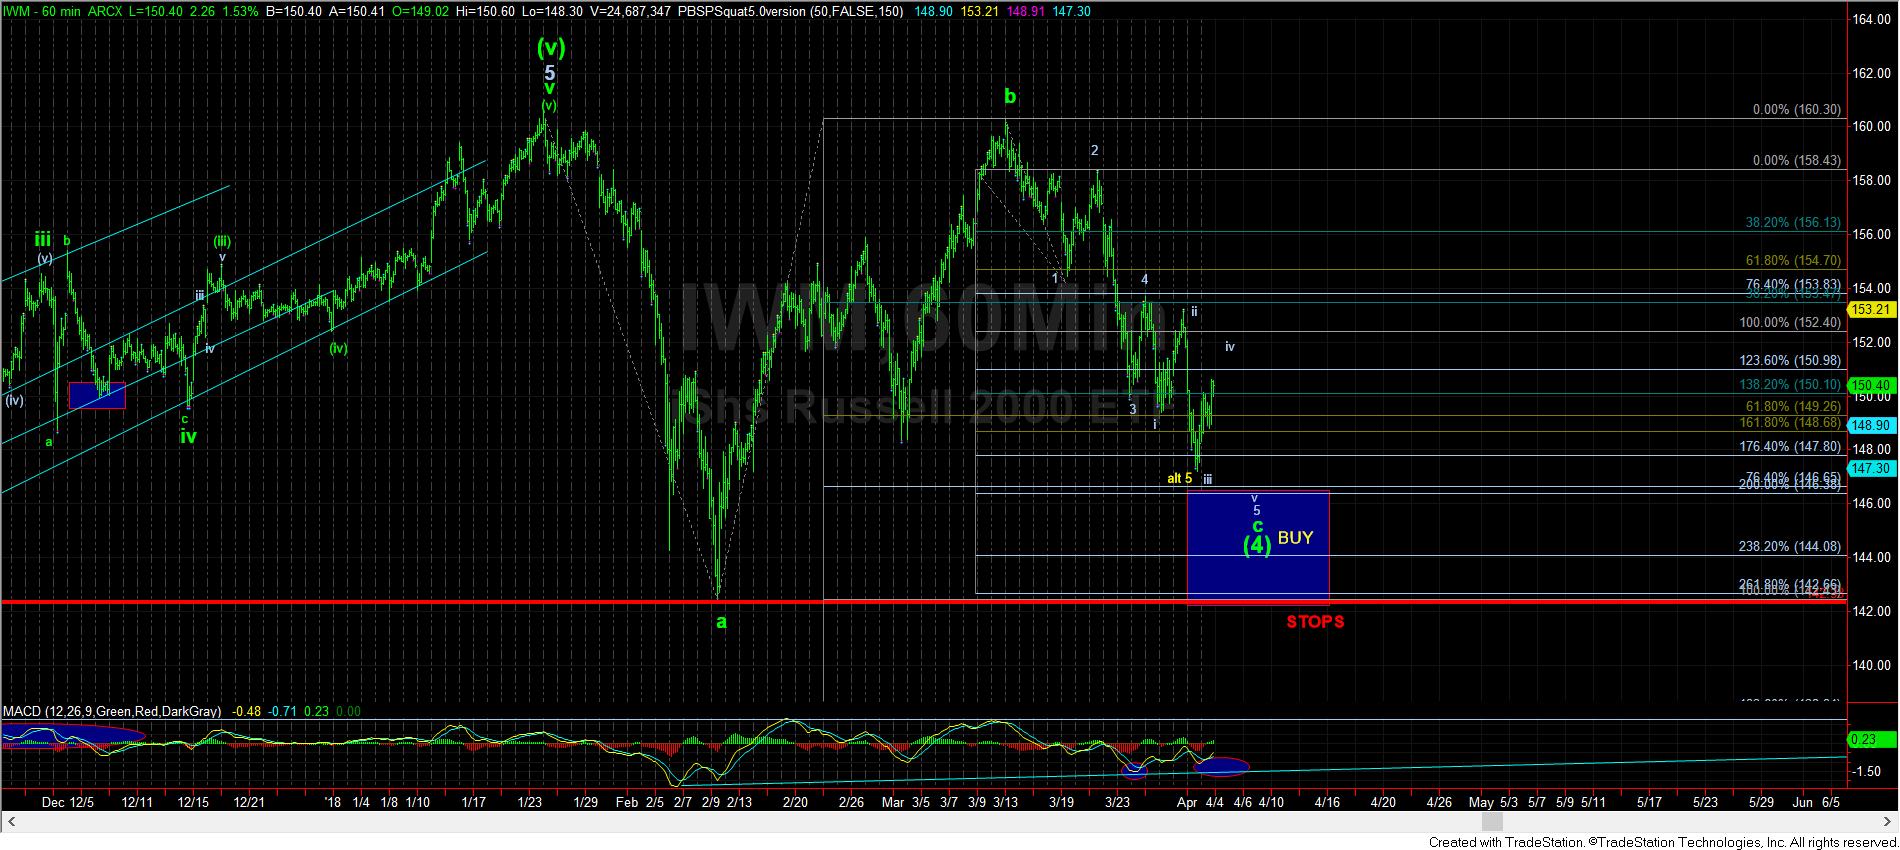
What is most interesting is that this pattern seems to fit most of the other charts as well. But, as I have been noting of late, the IWM has enough waves in place to consider it having bottomed already in wave (4), but we clearly do not have confirmation of that potential just yet.
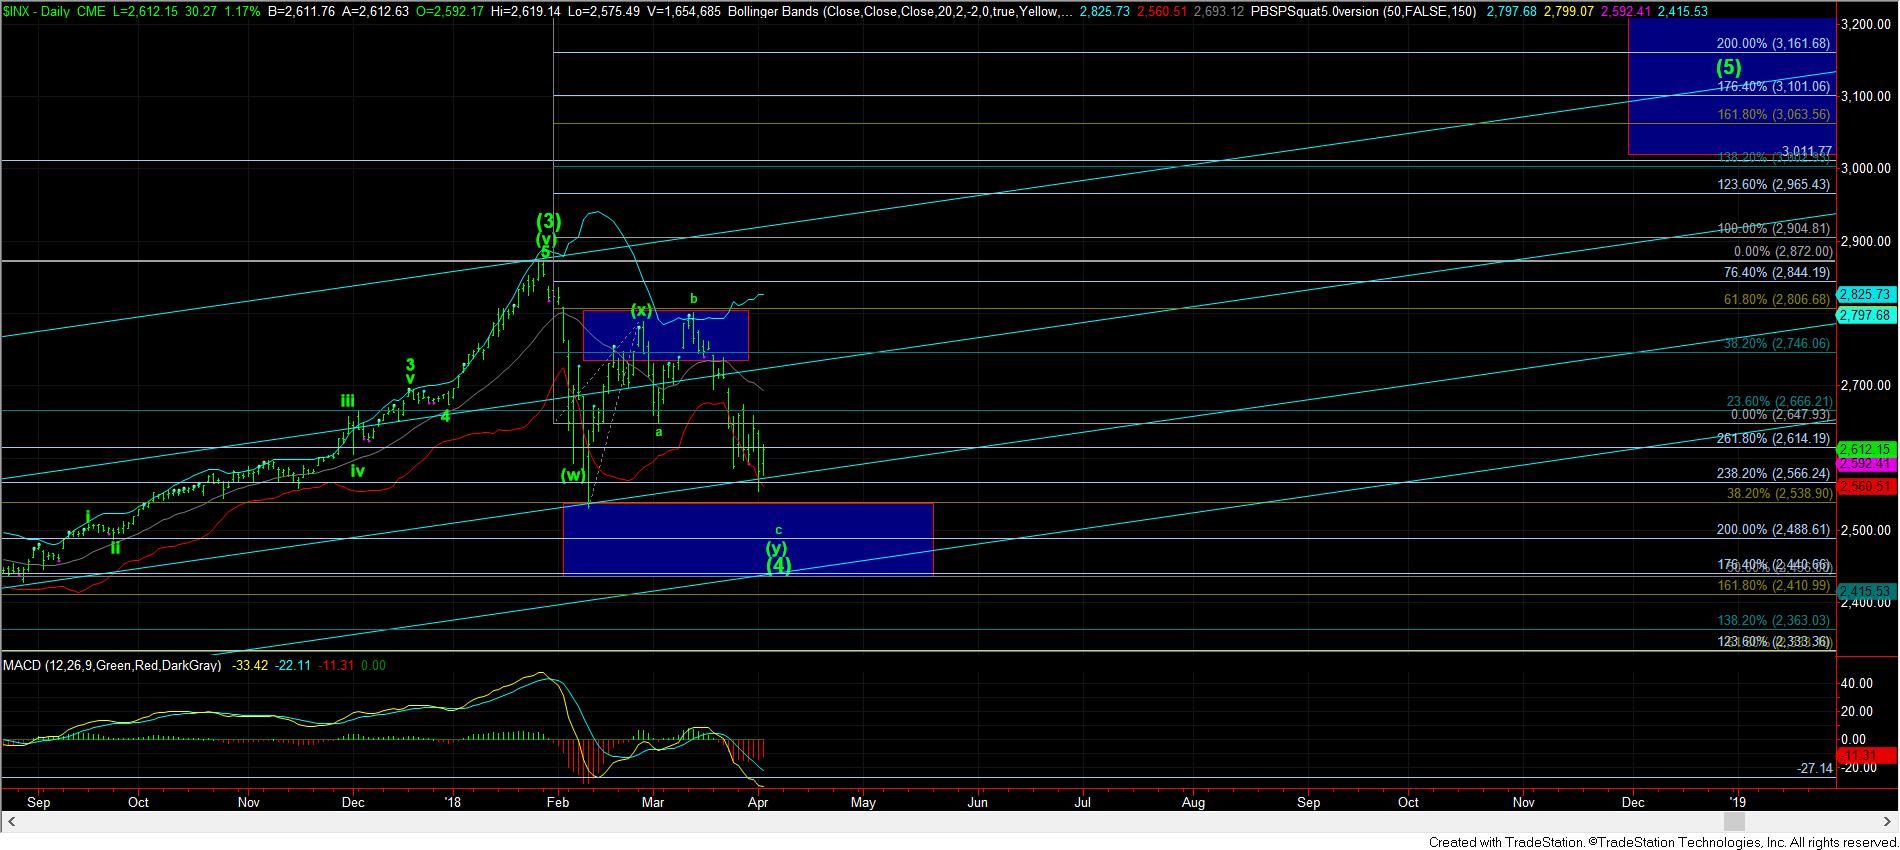
Ultimately, I still think we have another lower low potentially sitting out there, as long as we remain below 2650SPX. So, while we started the week with our resistance being 2685, we can now lower it to the 2650SPX region. As long as we remain below that region, I am going to be looking for this pattern to complete as an ending diagonal, and we may even see the completion of that pattern this week.
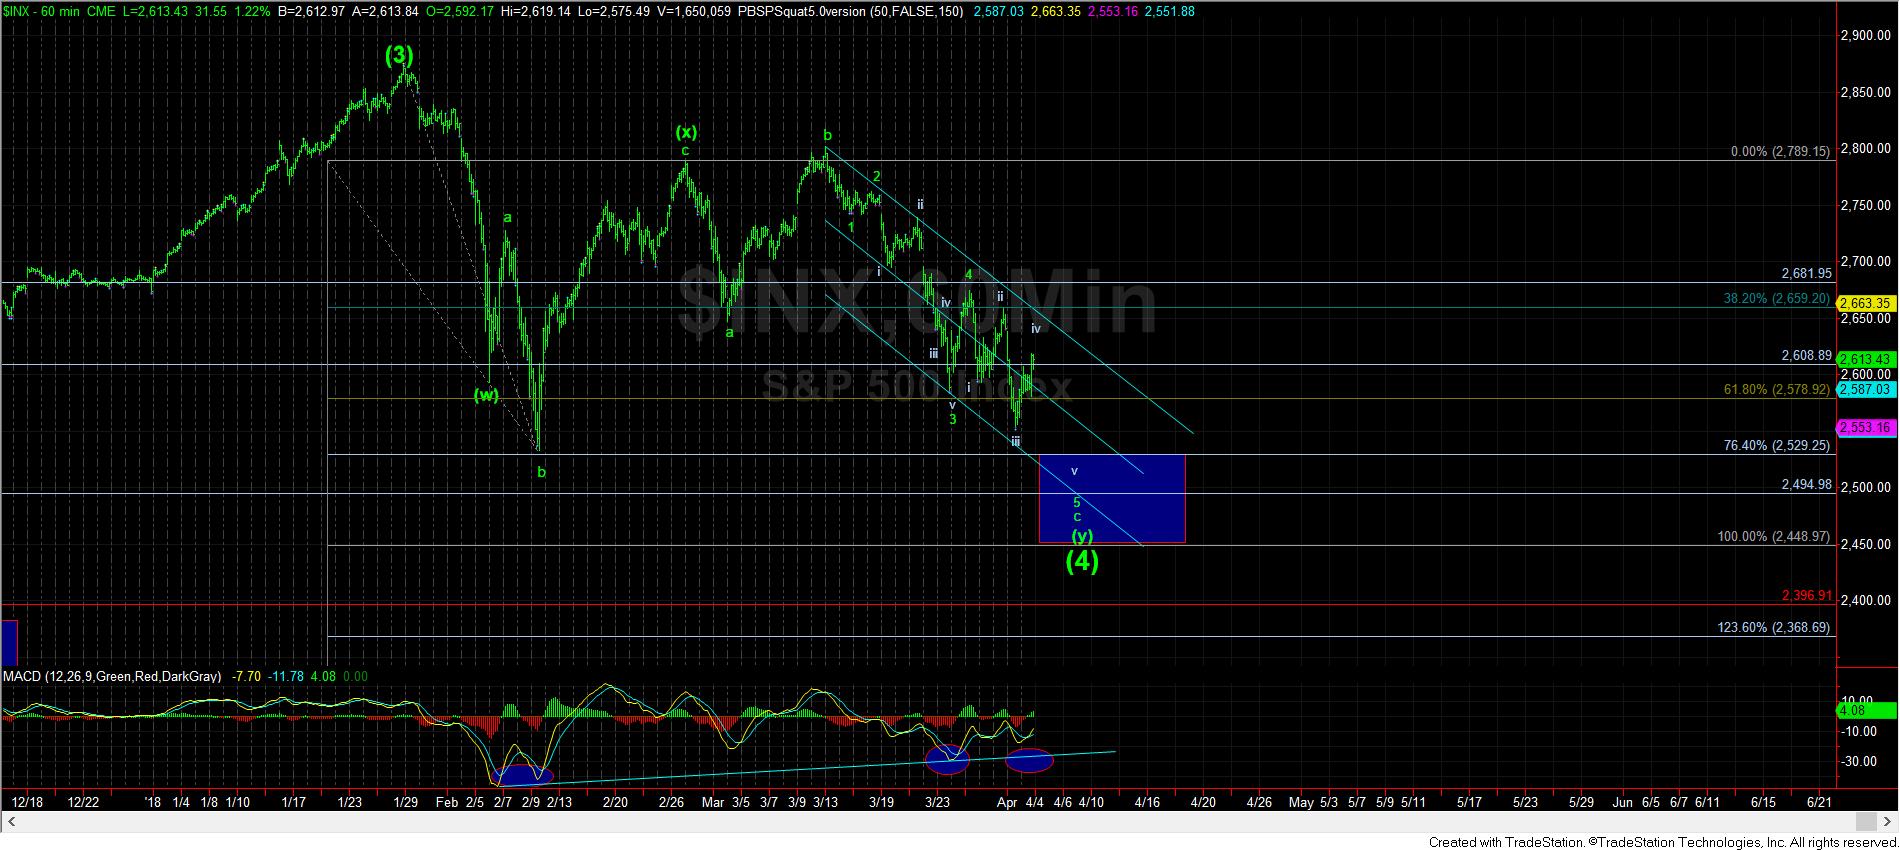
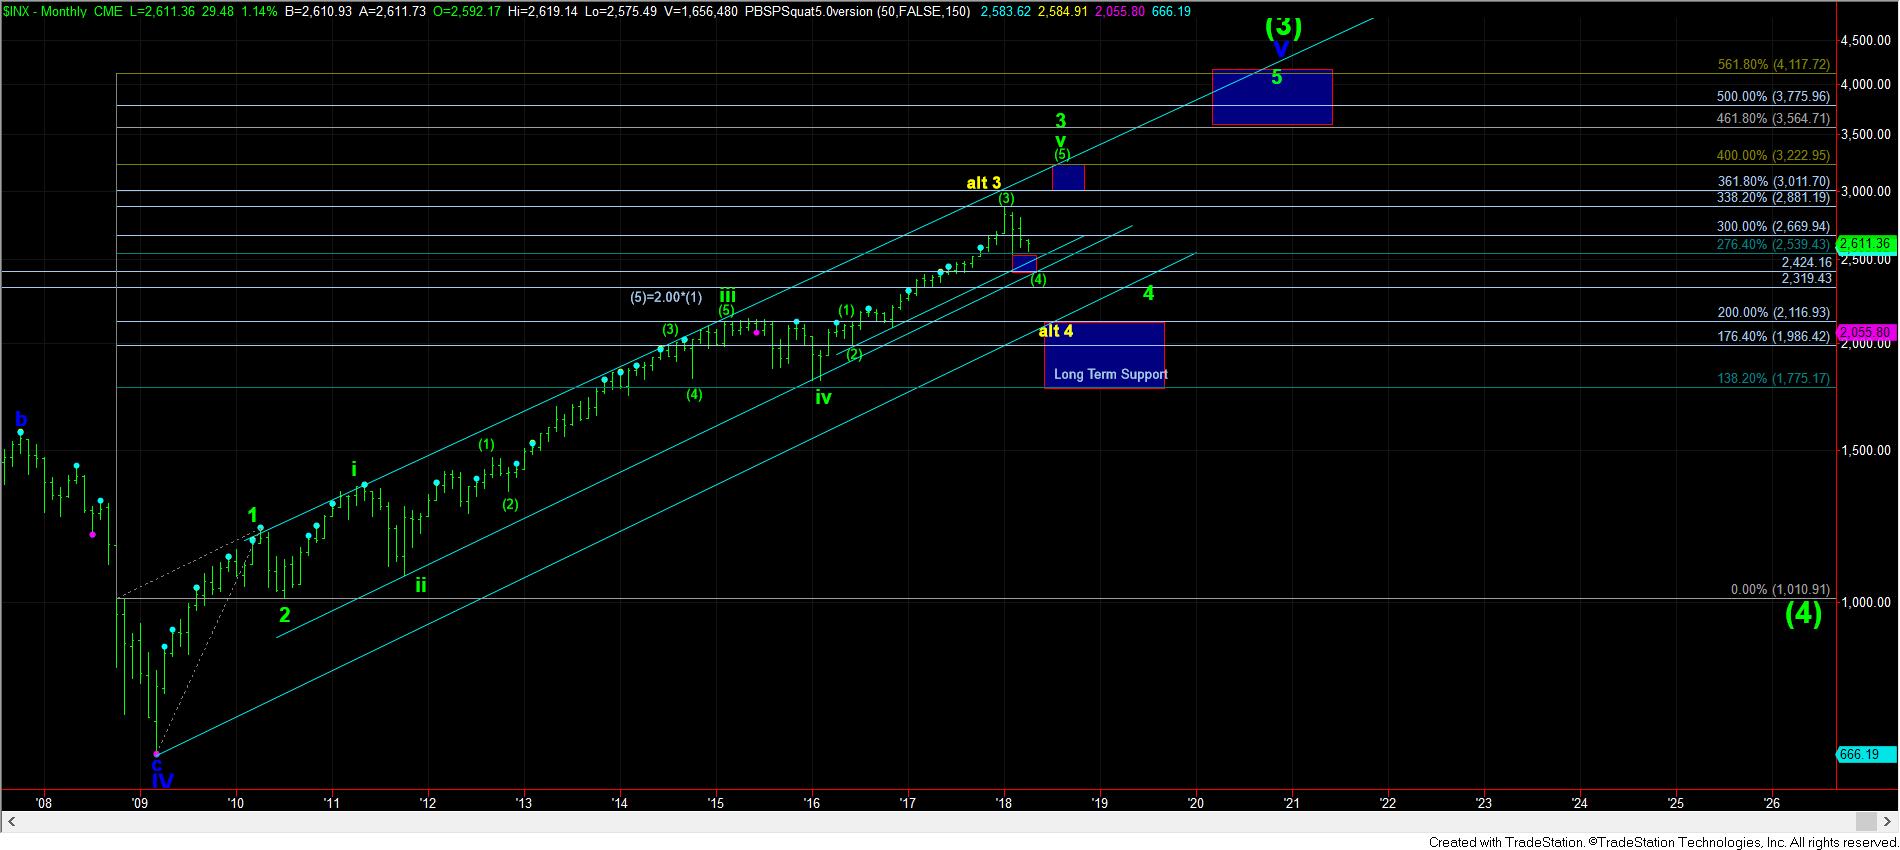
But, I am going to say this again to those willing to listen. The divergences we are seeing on the 60 minute charts is strongly indicative of bottoming action. As long as those divergences hold, and we remain over our target boxes for this wave (4), we are likely setting up the rally for wave (5), which should likely take us until the end of this year or early 2019, with targets in SPX in excess of 3000. Please keep that in the forefront of your mind at all times, especially as long as we remain over the target boxes we set for this correction.