We Are Left With A Series Of 4’s And 5’s
Yes, the bulls are still in charge, and they will remain in charge as long as the market remains over 2496SPX. That has not changed. But, that does not mean we will not see pullbacks along the way, even if the market is destined for higher levels in the more bullish primary count.
Before I go into the overall perspective, which also has not changed, I want to present what has changed, and explain why it has changed.
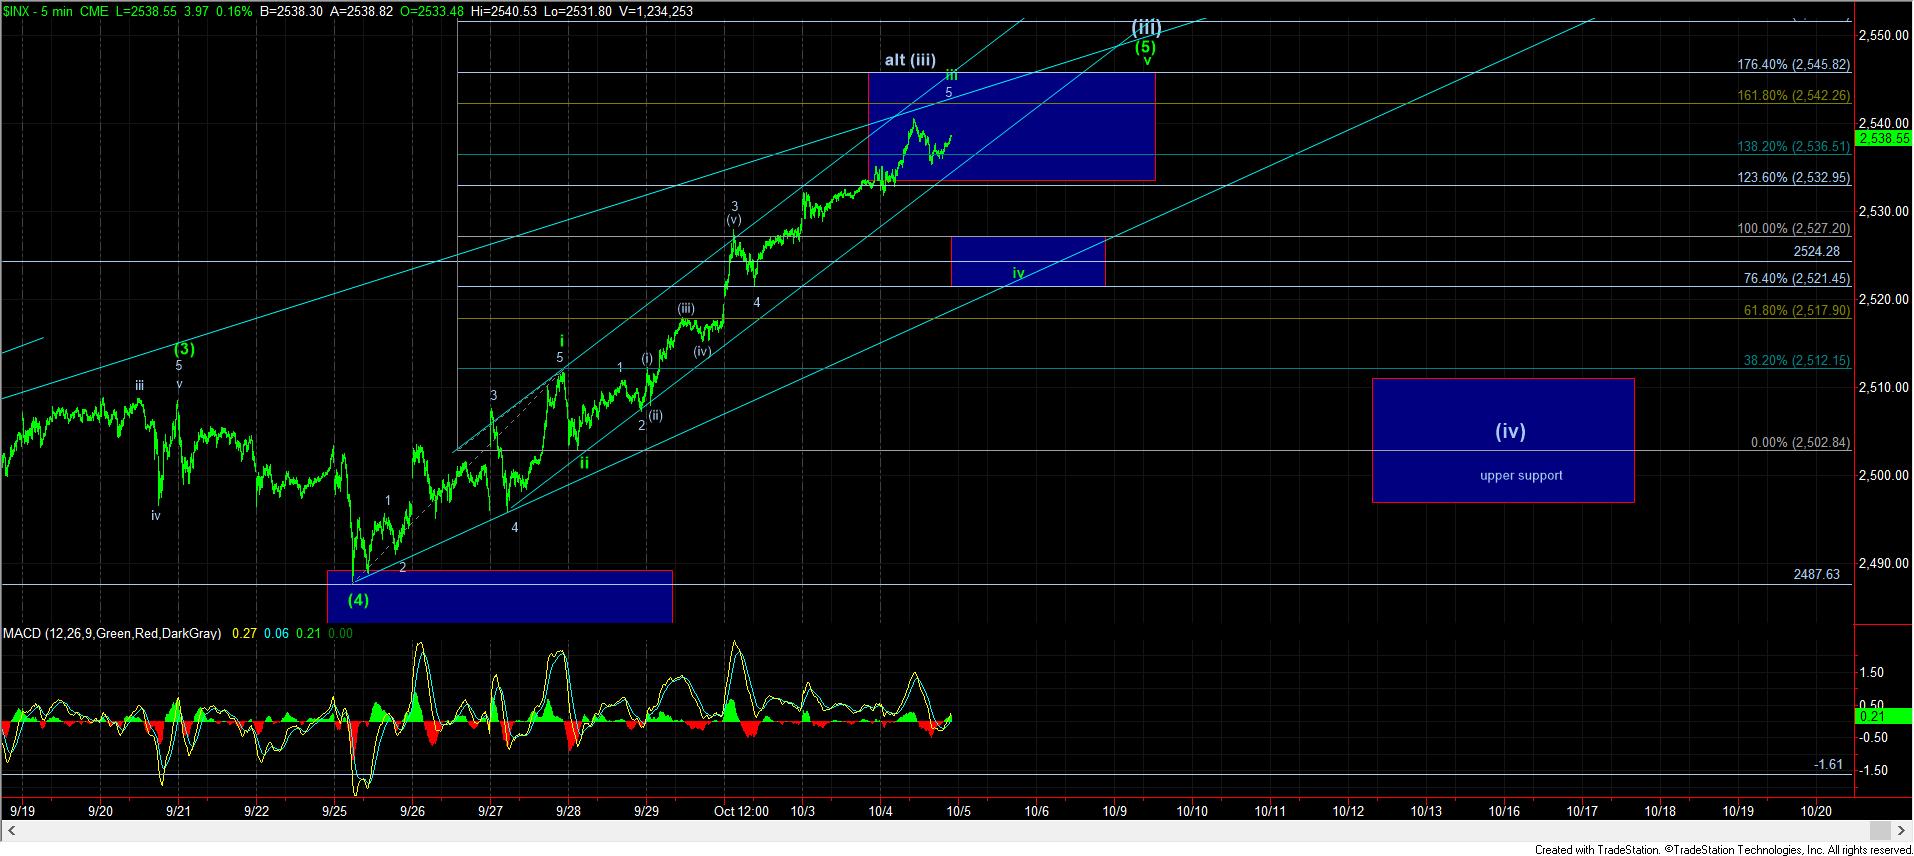
With the market extending as high as it has, it has made me question the micro count I have been presenting on the rally since 9/25 on our 5-minute chart. What has caused me some difficulty was the overlapping manner in which this rally began. While I had adopted the leading diagonal for wave i of this rally, I had initially counted the top of that wave on the peak struck the morning of 9/27. However, due to the targets we have now struck, I went back, ran through a whole host of calculations, and have modified my placement of the wave i top to the next higher peak, struck later the same day.
What this does is align the internal structure to a much better Fibonacci Pinball structure, but it is clearly something that I would not have been able to initially foresee due to the overlapping nature of the leading diagonal for wave i. But it now provides for us hitting the top of wave iii in the 1.618 extension region.
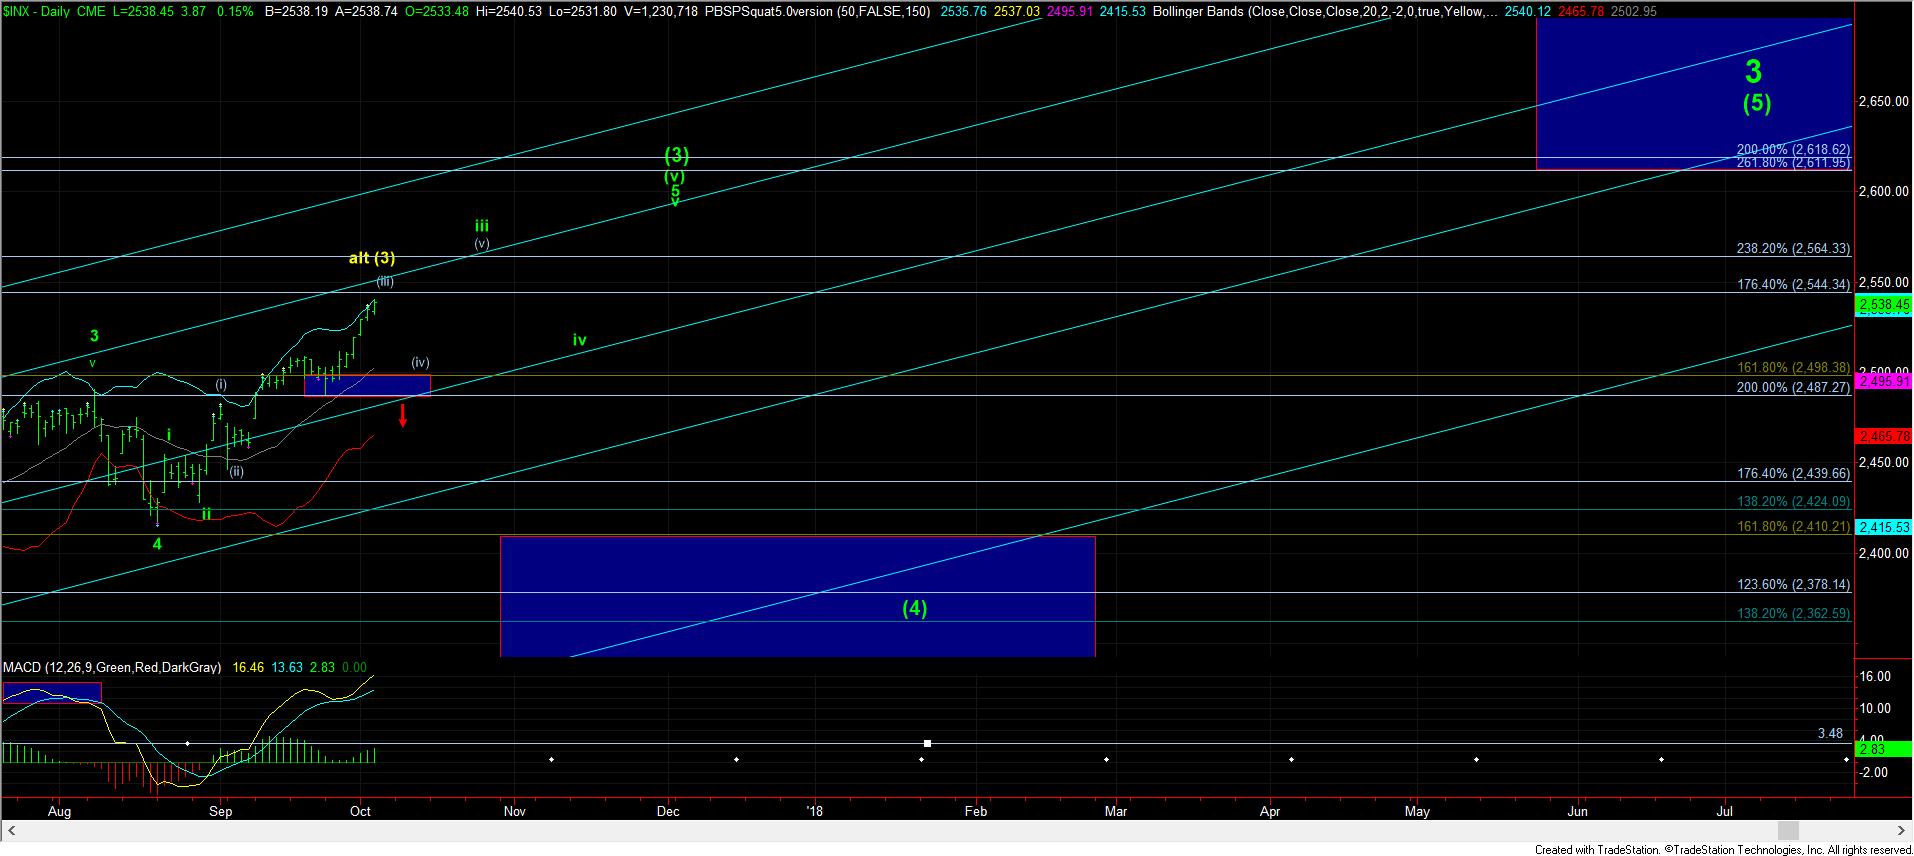
Moreover, we are also striking the upper Bollinger Band on the daily chart, and it suggests that we are nearing the point where we can expect a pullback to begin. The ideal structure would count the impending pullback as green wave iv, as shown on the 5-minute chart. The support for this wave iv resides between 2521-2527SPX. It would take a break down below 2521 to suggest that we may have to be on our toes for the ending diagonal presented on the 60-minute chart. But, as long as we remain over 2521SPX, I am looking for the market to rally up towards the 2545 region, which has Fibonacci extension confluence on many different time frames.
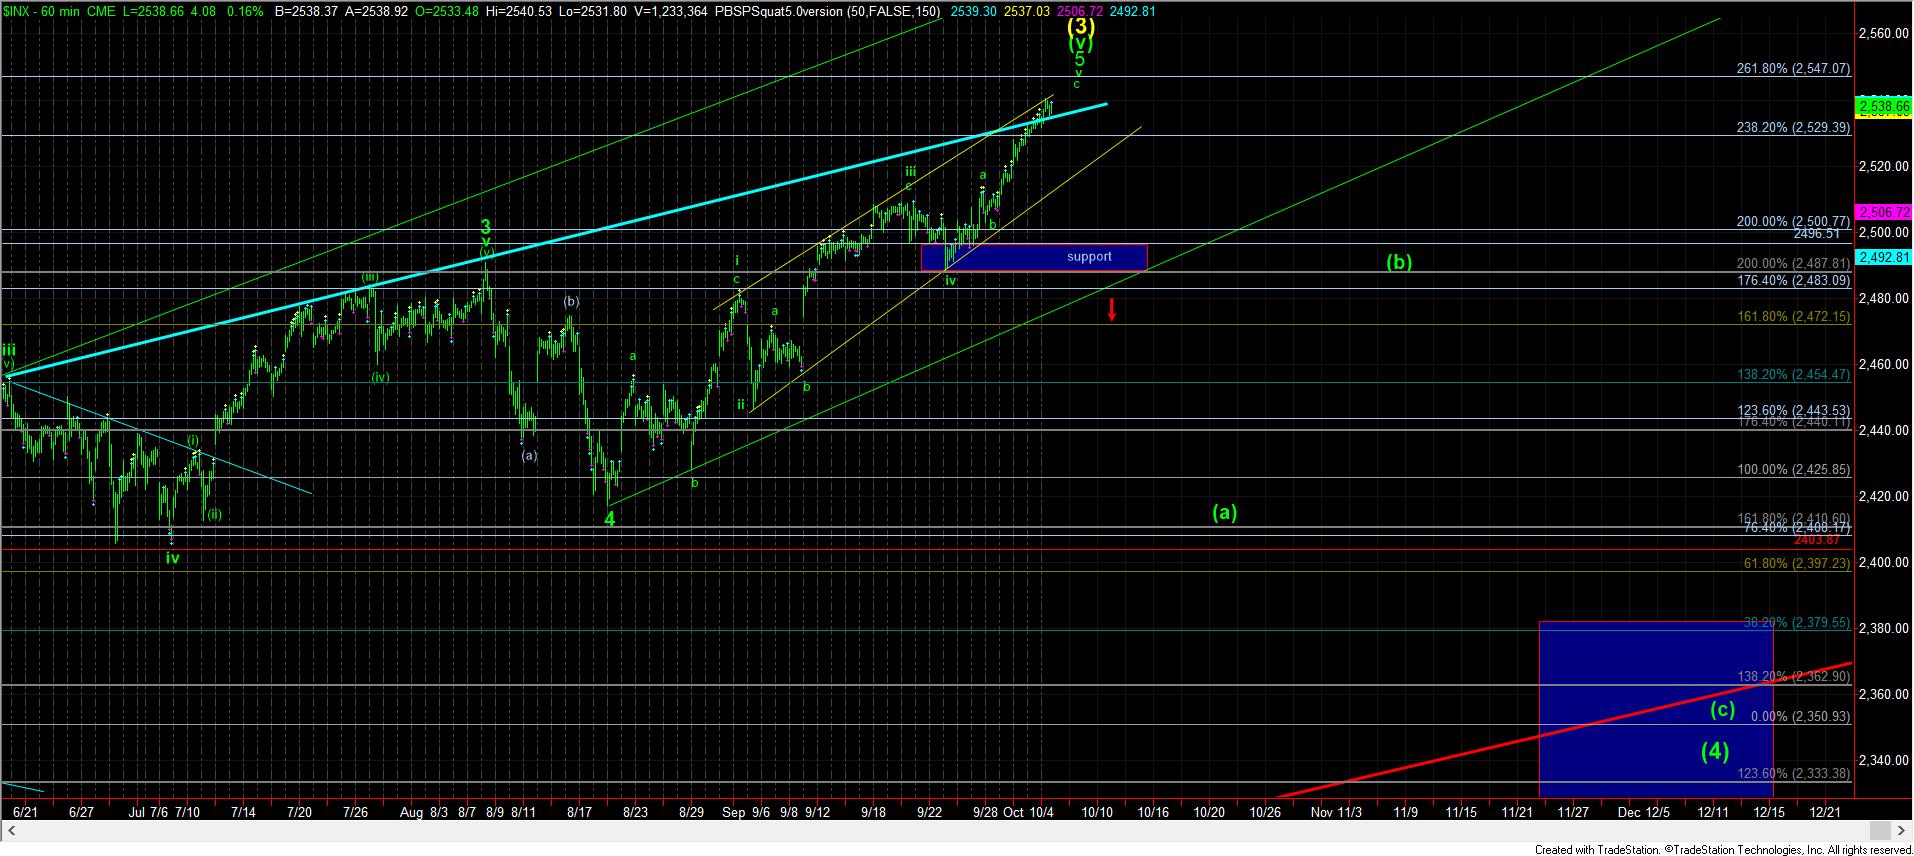
Alternatively, as I have been tracking for some time, we have enough waves in place for the ending diagonal structure, which is presented on the 60-minute chart. Again, PLEASE realize that this is the ALTERNATIVE count. I simply cannot adopt that structure unless the market breaks some support – which, right now, resides at the 2496SPX region. As long as pullbacks remain over that level, the bulls are in charge. In fact, I think we may even hold over the 2510SPX region on the wave (iv) pullback, and will have a better idea once we confirm where this grey wave (iii) tops.
Lastly, as the title suggests, as we complete this heart of a 3rd wave in the more bullish count on the daily chart, all we are now going to be left with is likely a series of wave 4’s and 5’s - (iv) and (v) of green wave iii on the daily chart, followed by green iv and v to complete wave 5 of (v) of (3) on the daily chart. This means that the strongest segment of the uptrend has likely completed, and we will now have a bit more volatility as we move up and down while making our way higher to complete this long term wave (3) off the February 2016 low. That means that it could take us another month or two to complete the full structure, but only move another 40-50 points higher.
So, when you take that into consideration, you have to make some determinations regarding the risk and reward left on the long side in this market. While we still can push up as high as the 2600SPX region, our minimum target for wave (4) below is 2400SPX, but more preferably, down in the 2330-80SPX region. Please never lose sight of the forest by focusing on the trees.