Wave ii's Back Is To The Wall
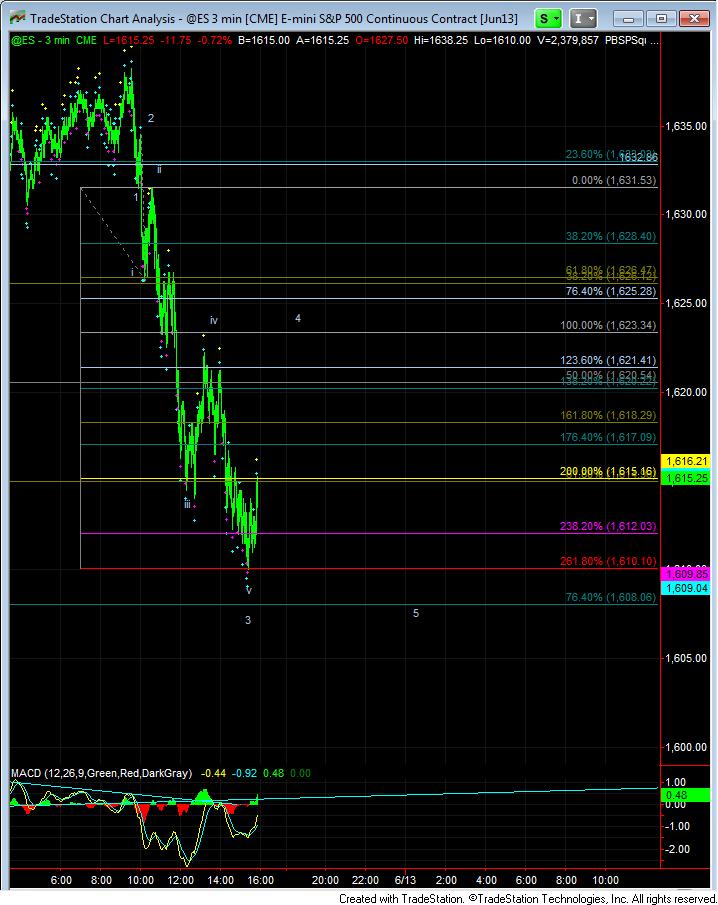
With the b-wave potential set up this morning, we were able to identify a potential short trade early on in the day when we saw 5 waves initial down off the high. We ended the day 20 points lower than that level, which was a nice trade for those that took it.
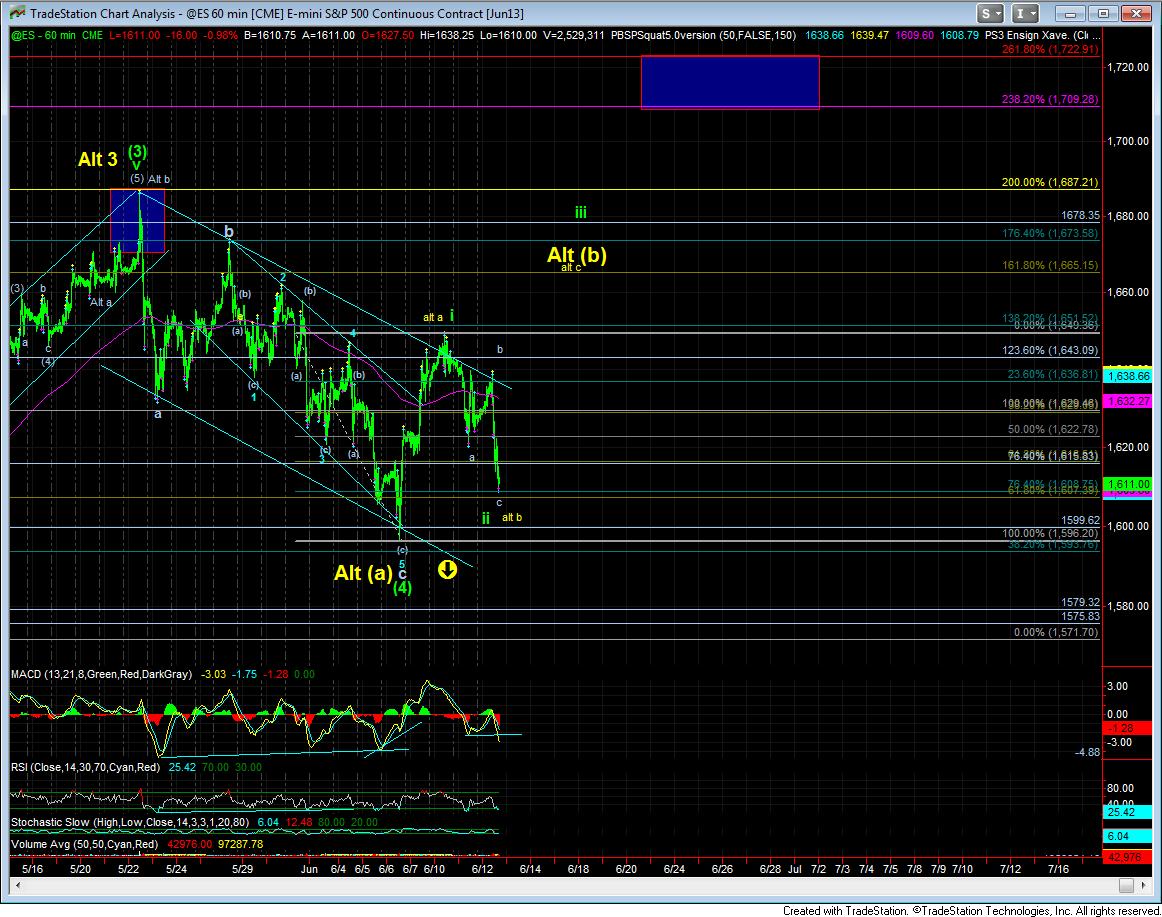
However, from the bullish side, the set up with the lower b-wave this morning points towards an a=c at the 1609ES region. There are supports lower than that at the 1607, 1602, and 1599ES regions, but a break of 1609ES would get me quite concerned for any bullish green wave (5) pattern to play out.
As the market dropped today, we have seen nice positive divergences develop on the 3 minute chart, but it REALLY needs a strong move up VERY soon to take it up to the 1620+ region in order to set up the type of divergence we would need to see on the 60 minute chart. In fact, the 60 minute chart is not looking to healthy at this time, as we normally like to see positive divergences between the a-wave and the c-wave. That is in danger of being seriously broken as we speak.
As for the downside, if the market were to take out the 1599ES region, which is where c=1.382*a, then I would suggest shorting corrective bounces, as my target for this larger yellow 4 takes me to the 1500 region, and potentially down to the 1470 region within the next month or two.


