Wave 4 Is Not Likely Over
When the market broke down below 4420SPX yesterday, it told us one thing with a high likelihood: wave 4 is not likely over.
So, now the question is how it resolves.
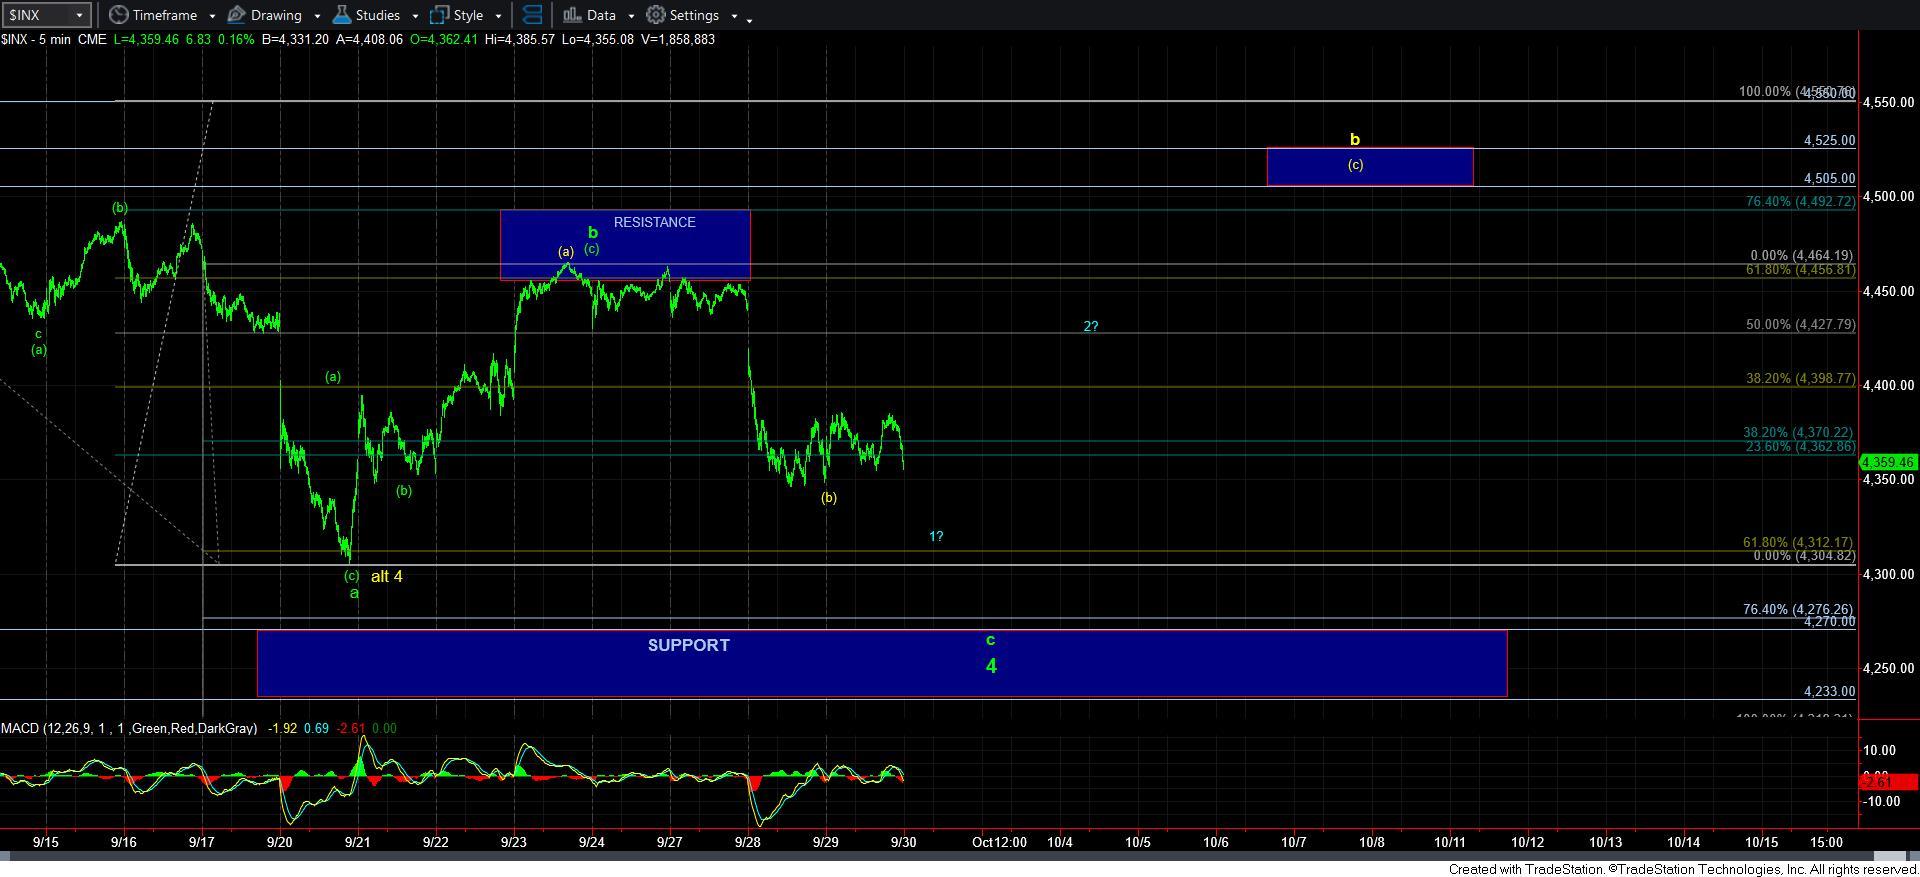
As it stands right now, we only have 3 clear waves down off the b-wave high. This leaves the door open to the yellow count presented on my chart. If we do not see a lower low in this drop, and the market begins to rally into tomorrow, then we may be tracing out a larger b-wave, presented in yellow now.
This bigger b-wave potential is in addition the potential for the i-ii structure outlined by Garrett in his update this evening. But, take note that this would be within an ending diagonal structure, which is quite complex in and of itself. Personally, I am not able to accept the ending diagonal scenario just yet until it proves itself with more action, so, for now, I am not using it as my primary count. I usually rely on the more complex structures as a last resort since I usually base my primary analysis upon the Occam’s Razor and KISS principles.
But, the main point that these structures are making is that the market will likely resolve in another drop to complete the c-wave at least the 4270/80SPX region. The question now is the structure with which we complete it. Believe it or not, the most elegant structure to complete the wave 4 to the downside would be to take us higher in the yellow [c] wave for a larger b-wave structure before we drop in the c-wave to the downside.
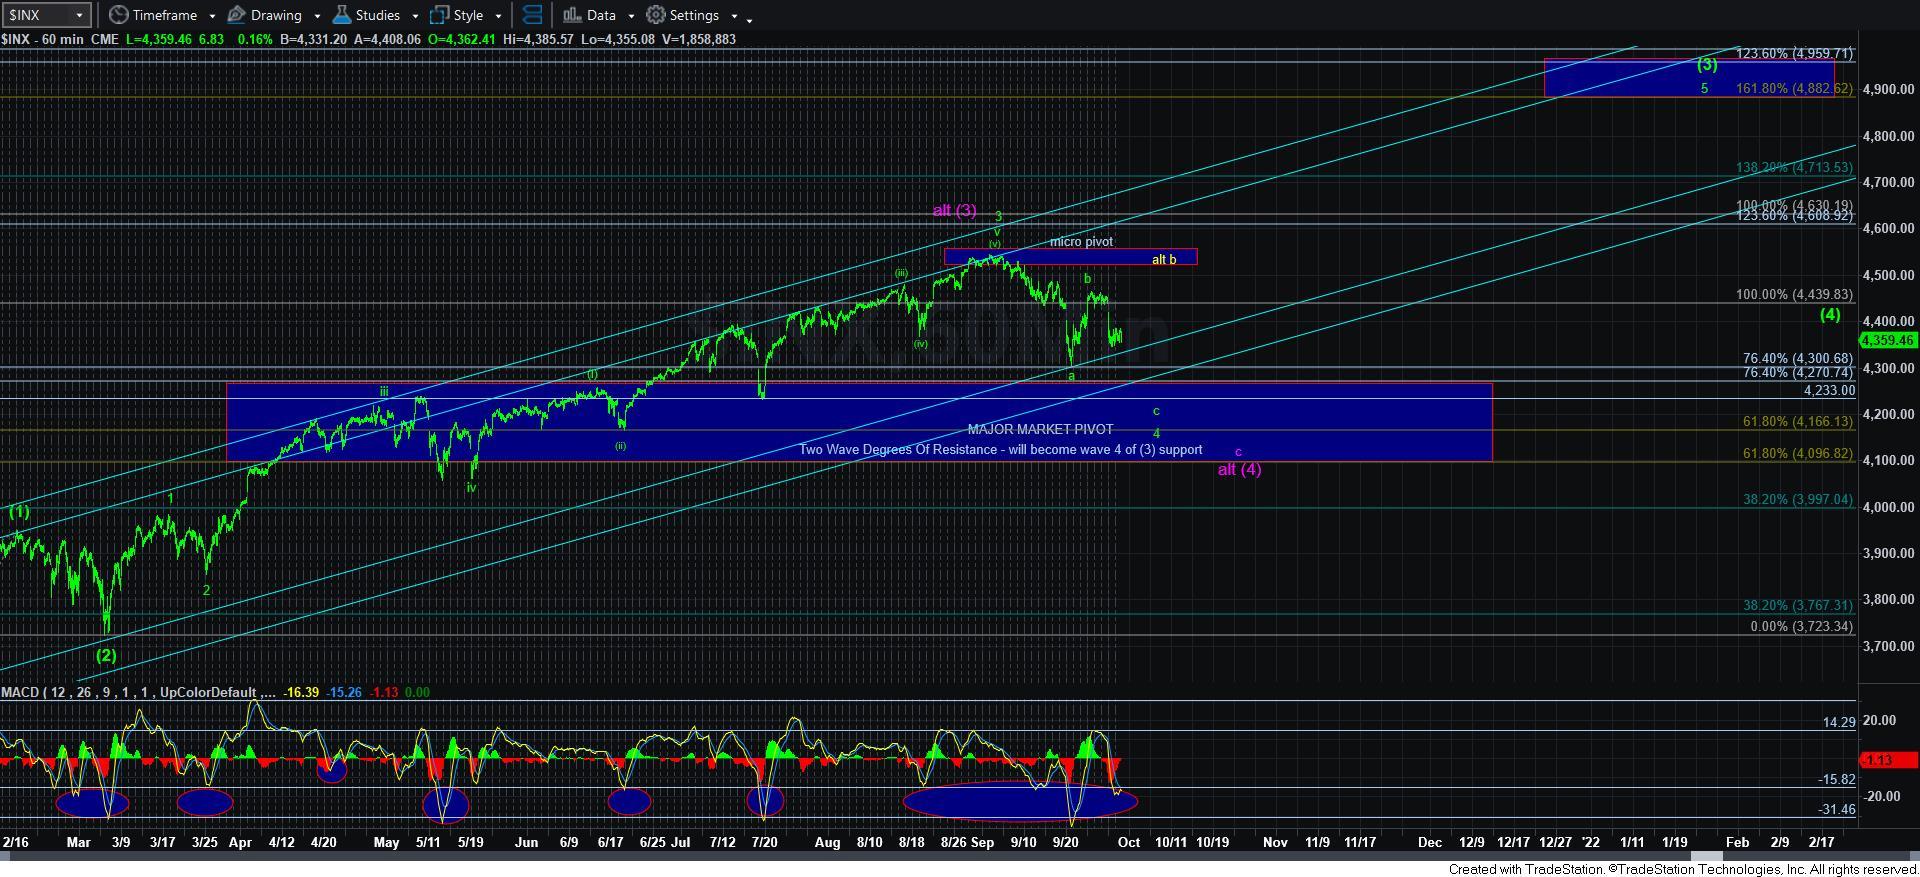
However, should we continue down into tomorrow, then much will depend on just how deep the next drop takes us. If we only see a marginally lower low and we hold the 4310-25SPX region, then it makes it more likely that this is just wave 1 in a much bigger c-wave which is likely going to target the .618 extension of the larger [1] [2] bullish structure on the 60-minute chart, which is in the 4165SPX region, and a common target for wave 4 within wave [3].
Furthermore, if the market breaks down and heads directly towards the 4270SPX region, the closer we get to that target region, the more likely the c-wave of 4 is completing sooner rather than later. In fact, the c=.764*a calculation points us just north of the ideal 4270SPX minimum target I have had for this c-wave.
So, in summary, I think the strong likelihood is that wave 4 is not yet done because we have broken down the 4420SPX support before completing 5 waves up. That tells us that the last rally was corrective in nature, and that wave 4 is still ongoing. Again, this means that it is highly likely we will see at least the 4270/80SPX region before wave 4 is done, with some potential for us to drop as deeply as 4165SPX, depending on how the structure develops in the coming days.
Therefore, how the market moves in this current region will give us a better indication as to just how low this 4th wave can complete. Remember, 4th waves are quite variable and can take many twists and turns before they complete. And, until we actually see a 5-wave c-wave complete into at least the 4270SPX region, this still can take more twists and turns for a bigger b-wave within wave 4 before this 4th wave completes.