Wave 4 Clearly In Progress
While I was viewing the potential that wave 4 was in progress to a greater degree since the 3-wave rally off support last week, I certainly did not expect that we would drop directly below 4400SPX. So, I do apologize for that miss. While it was definitely one of the 5-6 scenarios I had rolling around in my head, which I noted over the weekend, I did not see the direct break of that support as the most likely scenario.
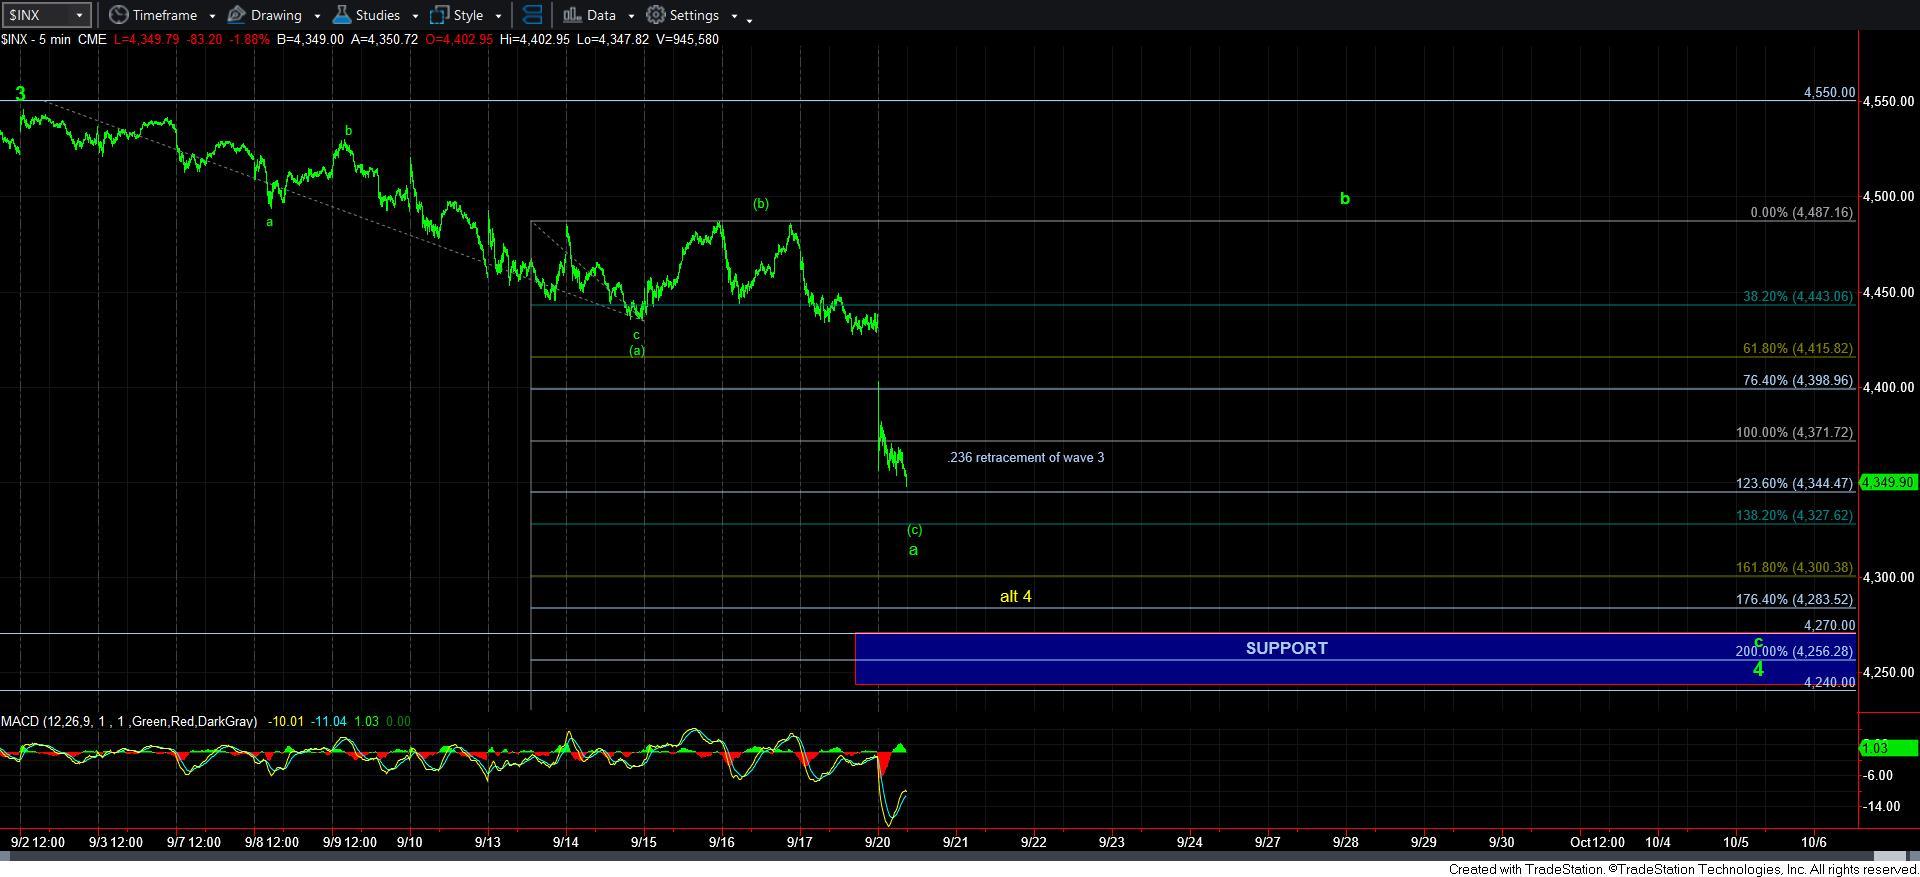
In the meantime, the market has now dropped to just below the .236 retracement of wave 3. So, I am writing this update a bit early to give you an opportunity to begin your planning.
At this point in time, the question is if the market is going to pull off the band-aid in one swift action, or if it is going to do so more slowly. You see, due to the structure of the current decline, as long as we hold over the 4325SPX region, this wave 4 can take us into October, as we can see another b-wave rally before dropping back down in a bigger c-wave to complete wave 4. But, if we can break down directly below 4325SPX, then it makes the potential that we are completing wave 4 sooner rather than later much more likely.
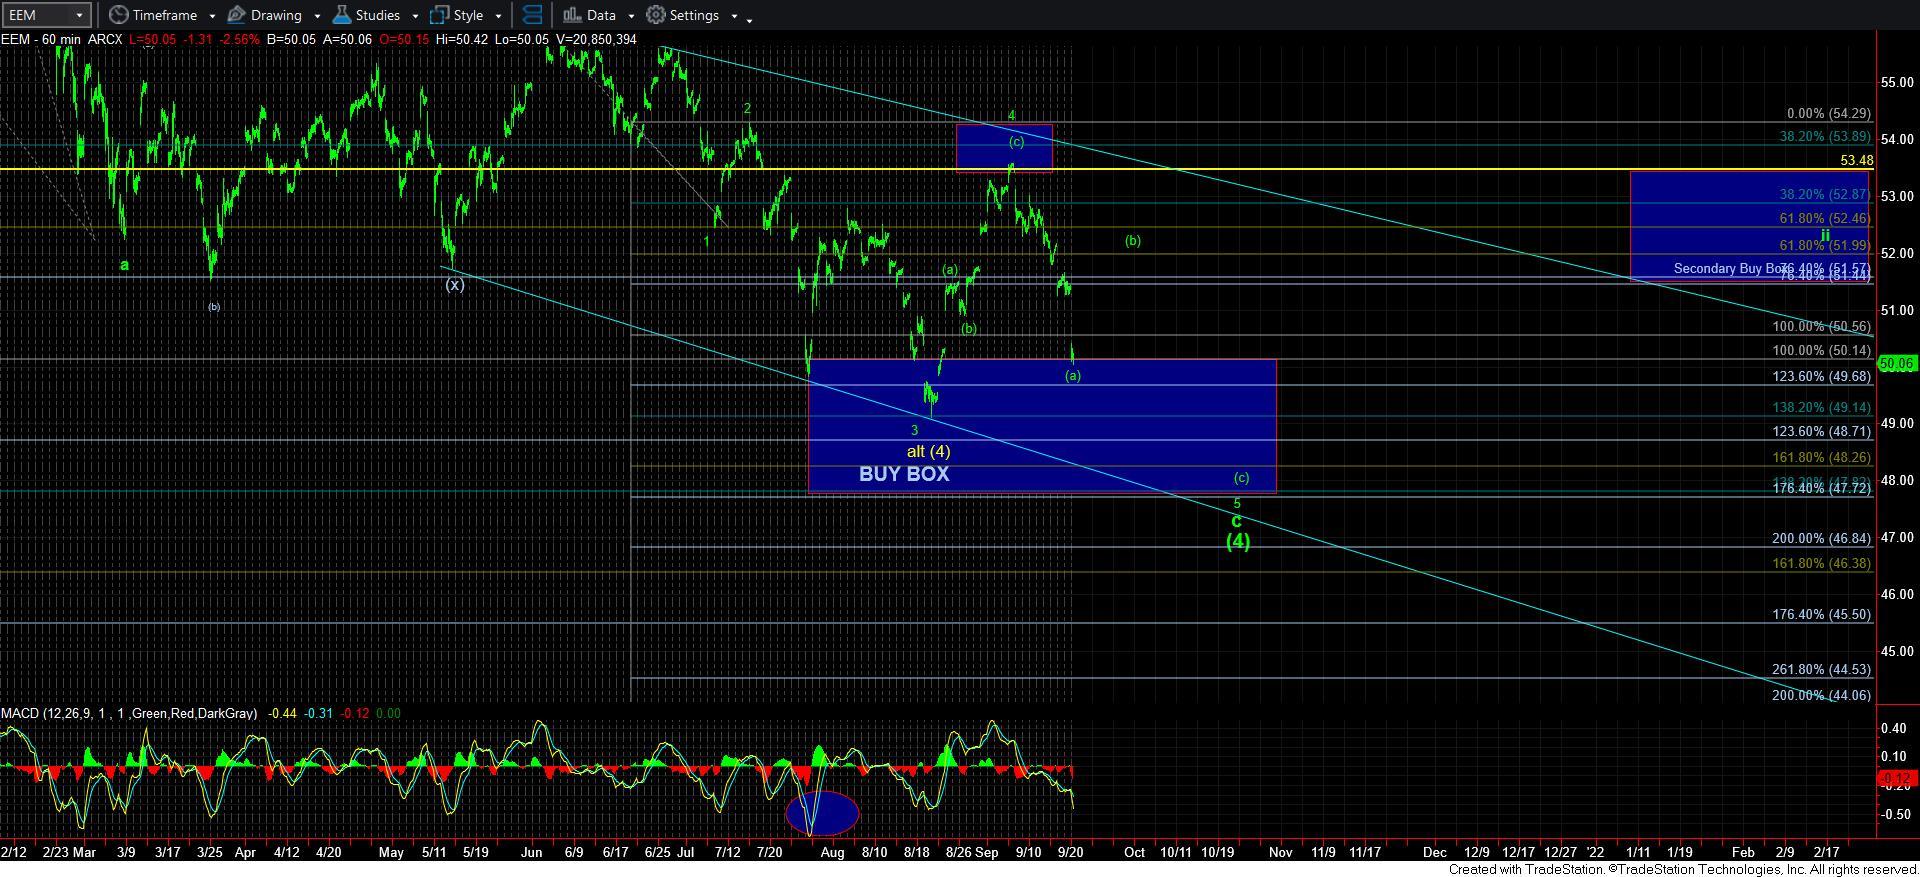
If I was to go by the EEM structure, I would say the b-wave rally is more likely. As you can see from the attached EEM chart, a [b] wave rally from around here would fill the pattern in much better. But, should we continue to drop in a more direct fashion and see a 48 handle, then I will NOT stand around to argue with the market, and I will simply be hitting the buy button.
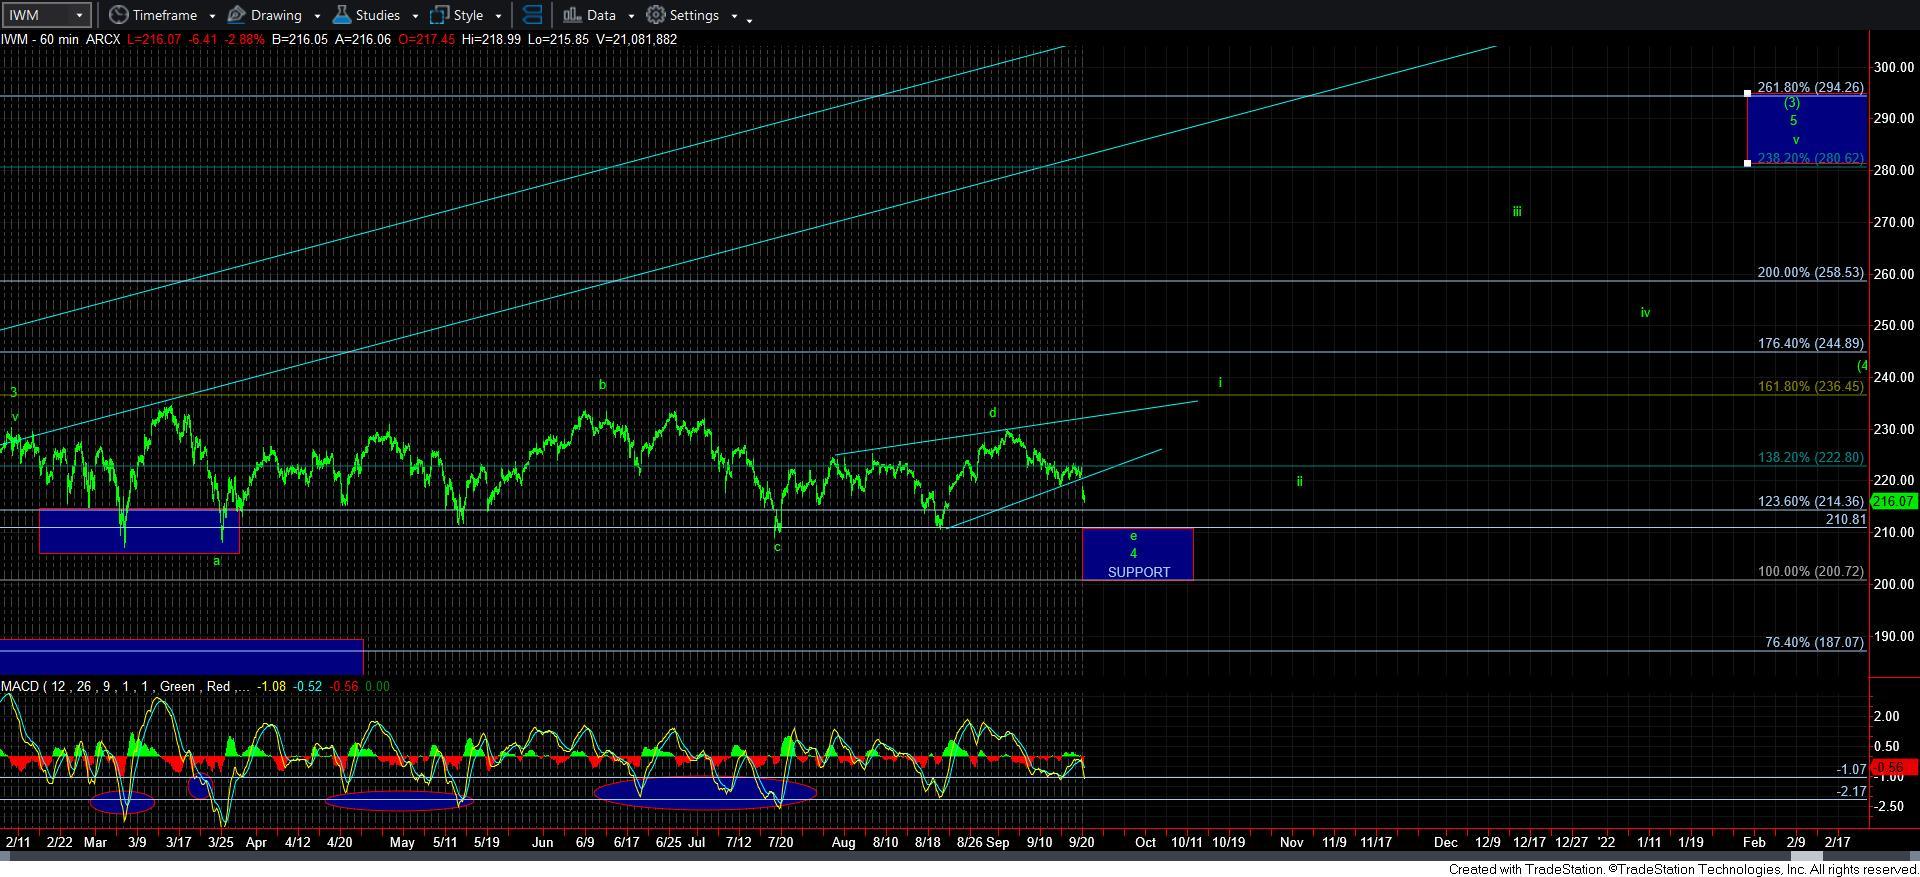
As far as IWM is concerned, this certainly looks like wave 4 is not yet complete. But, please recognize where support resides, along with where our next target resides on the top right side of the chart. As you can see, the upside significantly outweighs the downside potential as we look towards 2022.
So, to summarize the SPX, we have 4325-4345SPX as our micro support which can complete a bigger a-wave within wave 4. As long as that support holds, I think it is reasonable to expect a corrective rally in a b-wave. But, if that rally is CLEALRY impulsive, I will not hesitate to consider the bottom to wave 4 as having been struck. We have now dropped just below the .236 retracement of wave 3, we have seen a 200 point pullback off the market high, and we can consider this to be all of wave 4 if the market tells us so with a clear 5-wave rally.
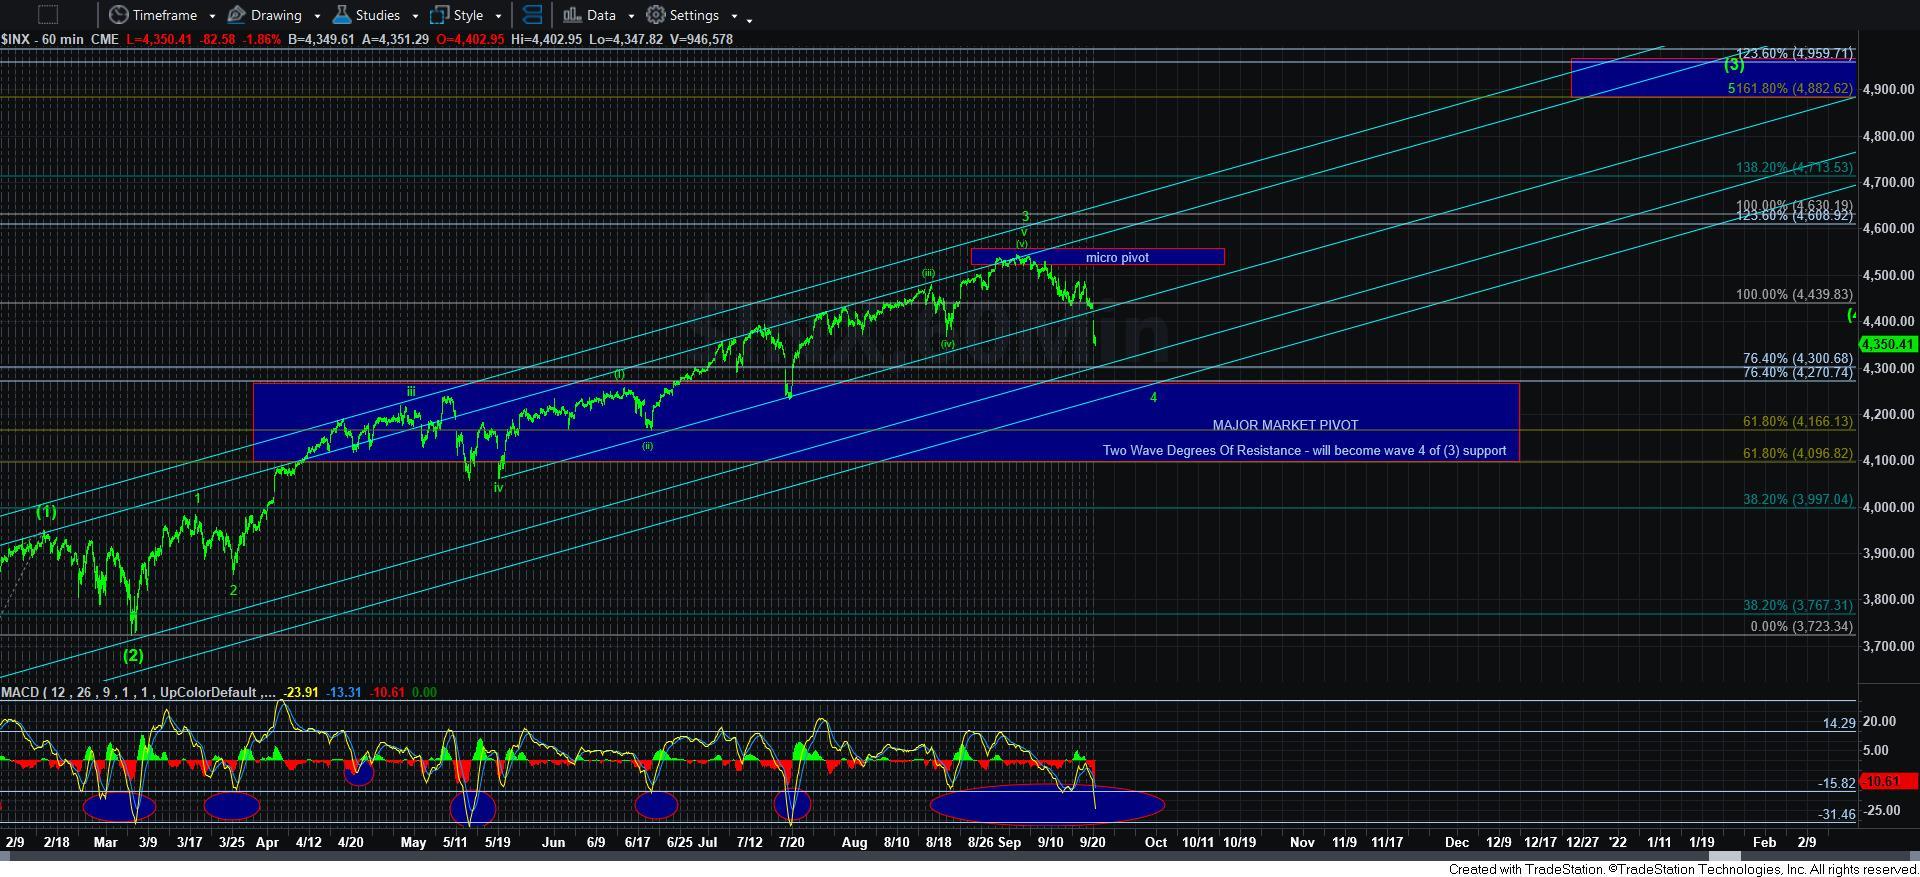
But, until such time that I see a clear 5-wave rally, I am going to assume we will strike our ideal target region in the 4240-70SPX region, with outside potential to drop as deeply as the 4165SPX next lower support region.
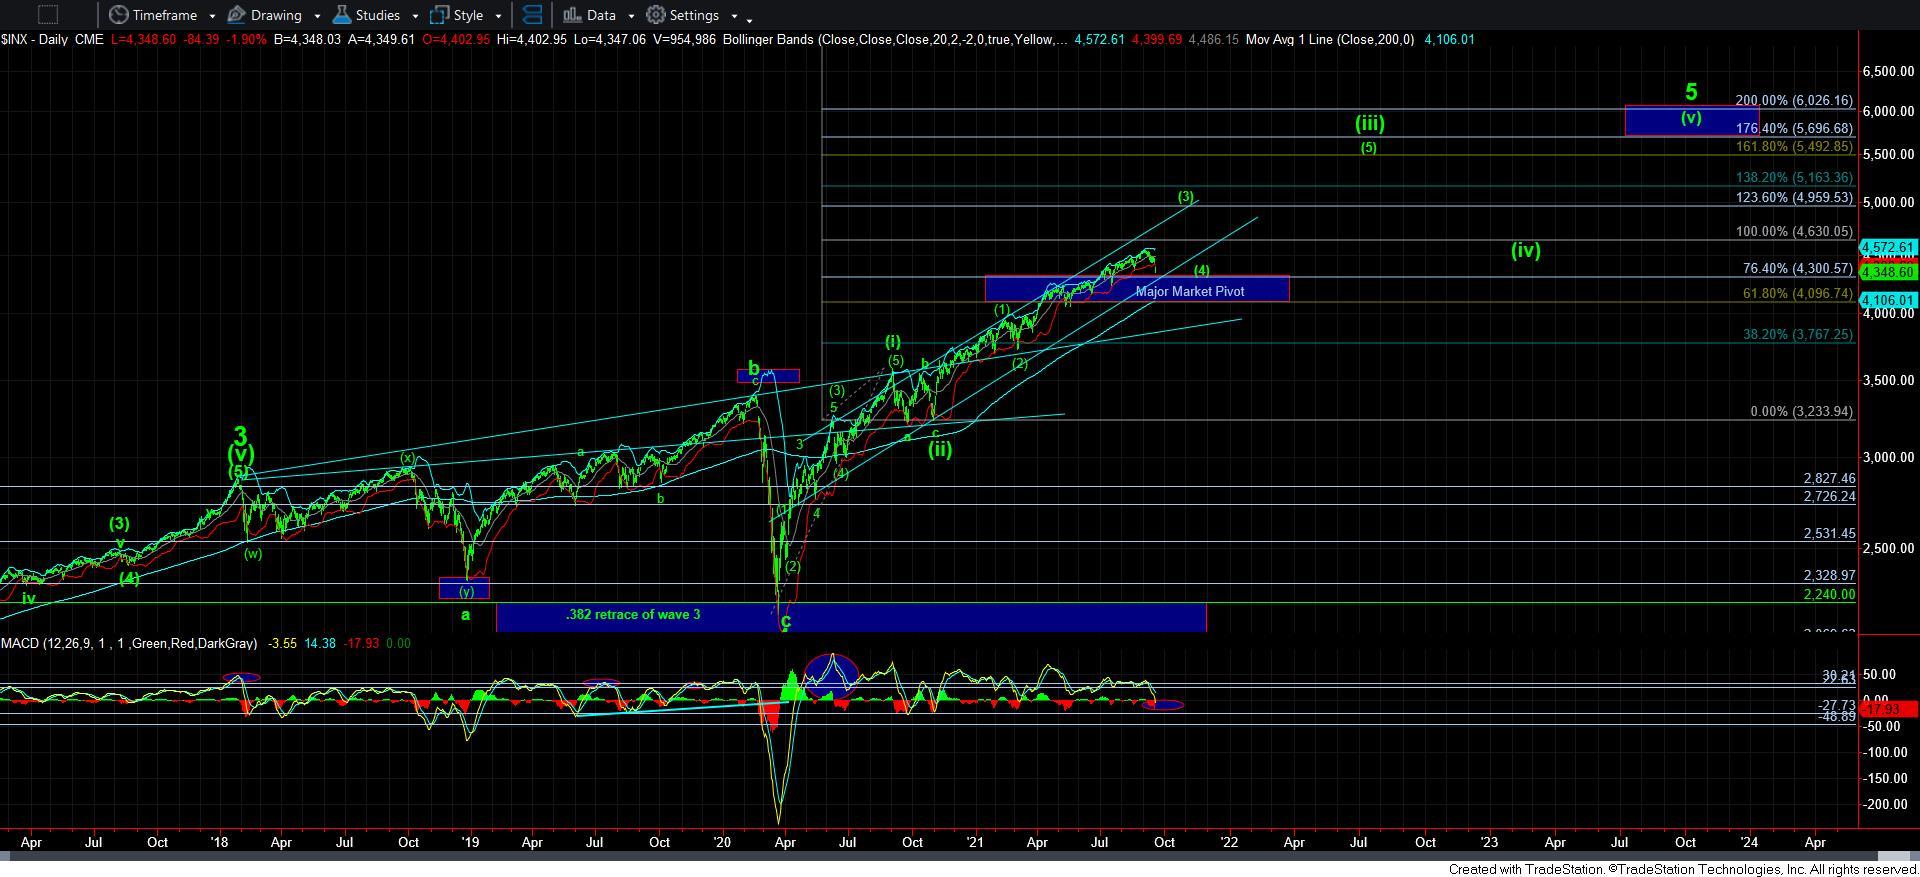
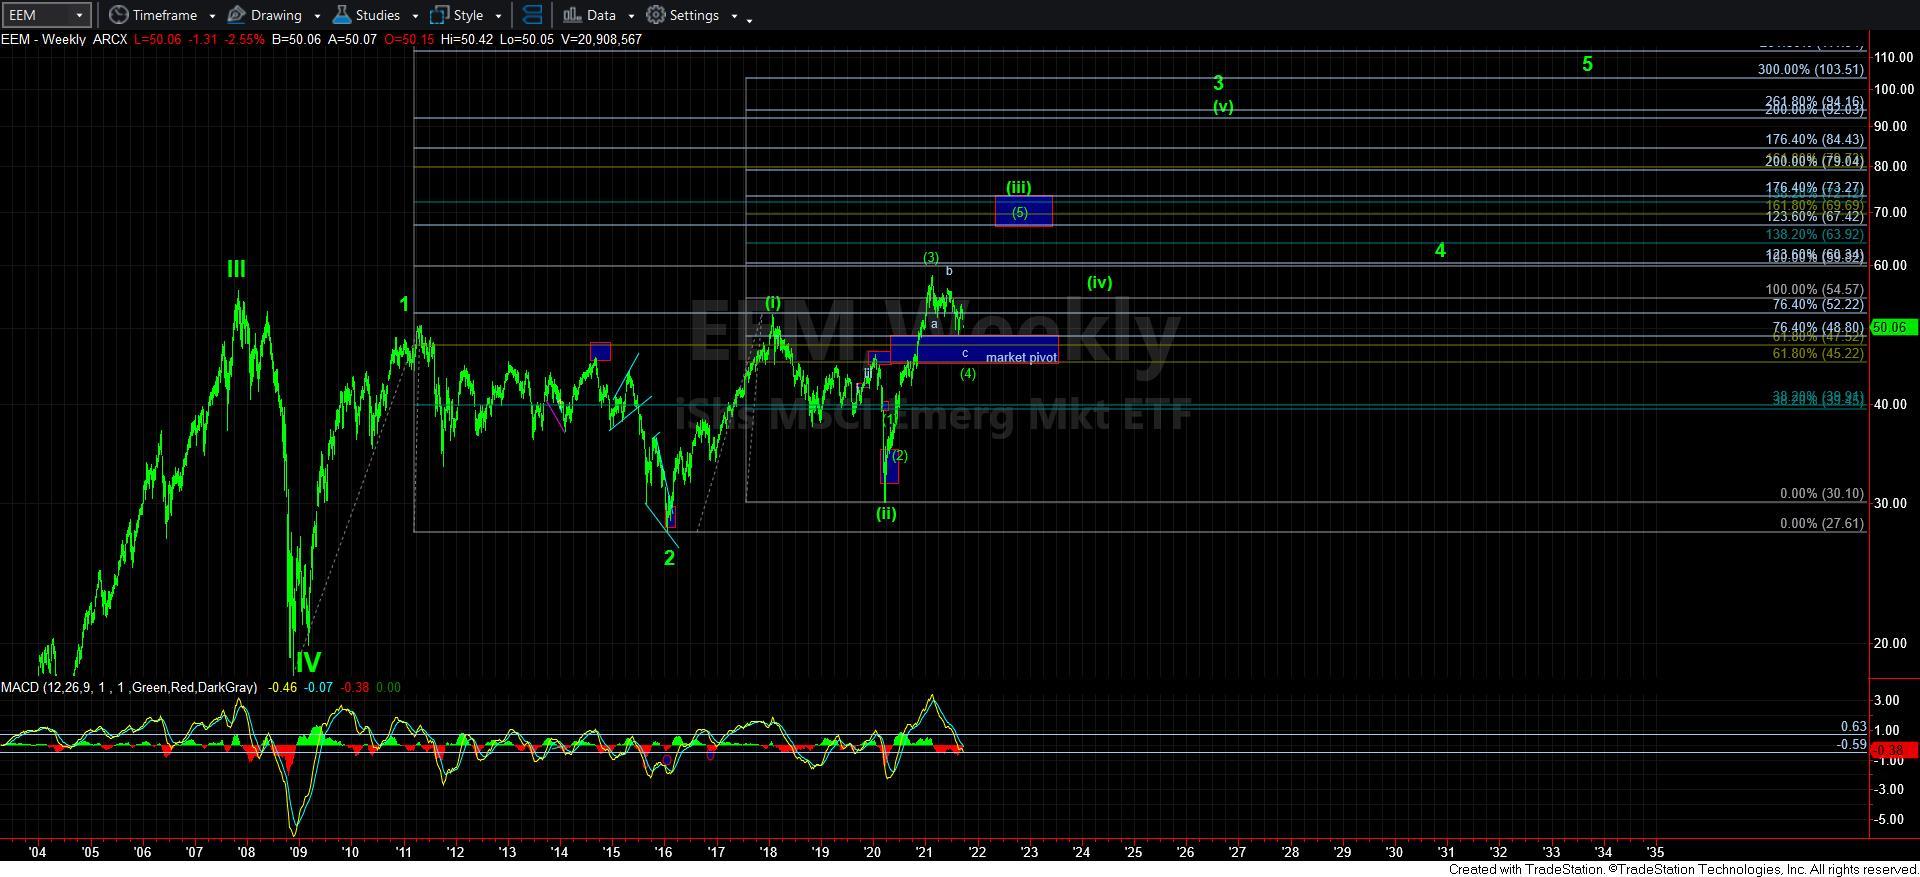
In the bigger picture, please realize that we are now approaching the expected test of the MAJOR MARKET PIVOT which we see in wave 4 of [3]. Moreover, the MACD on the 60-minute chart is dropping into a deeply oversold point from which many rallies have begun. Furthermore, the MACD on the daily chart is now the most oversold we have seen all year, as we are approaching the levels seen for wave (ii) That means I am a buyer as we get closer to that major market support. And, I will be focusing a lot of my buying on the EEM and IWM charts for now.
But, again, I do apologize for not foreseeing the direct break down below 4400SPX.

