Watching For Topping Signals
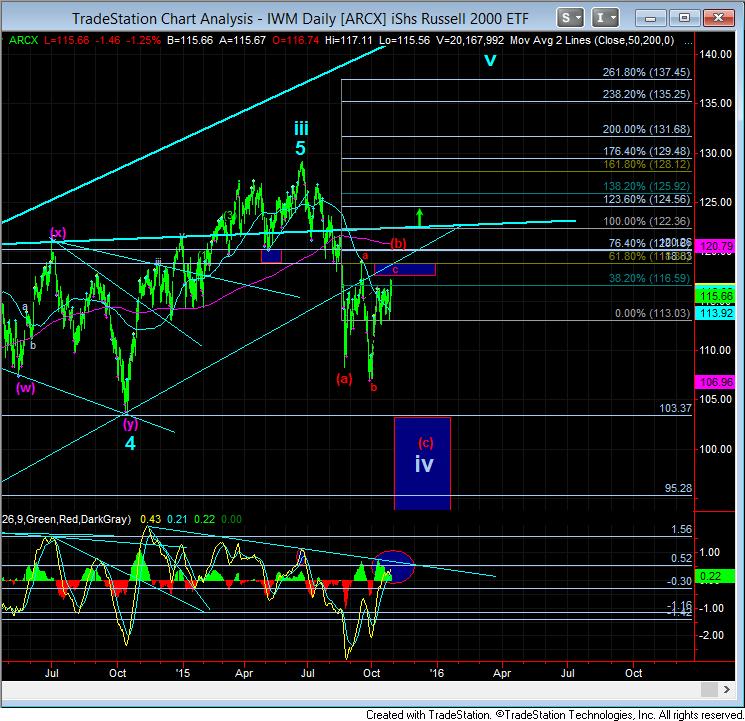
Last night in the trading room, I was chatting about the IWM. When I went back to look at the longer term chart on it, it really is quite an ugly picture and provides no confirmation that a bottom to this 4th wave has been seen. And, as bullish as the SPX seems to be, the IWM is a lagging terribly and even looks somewhat bearish at this time.
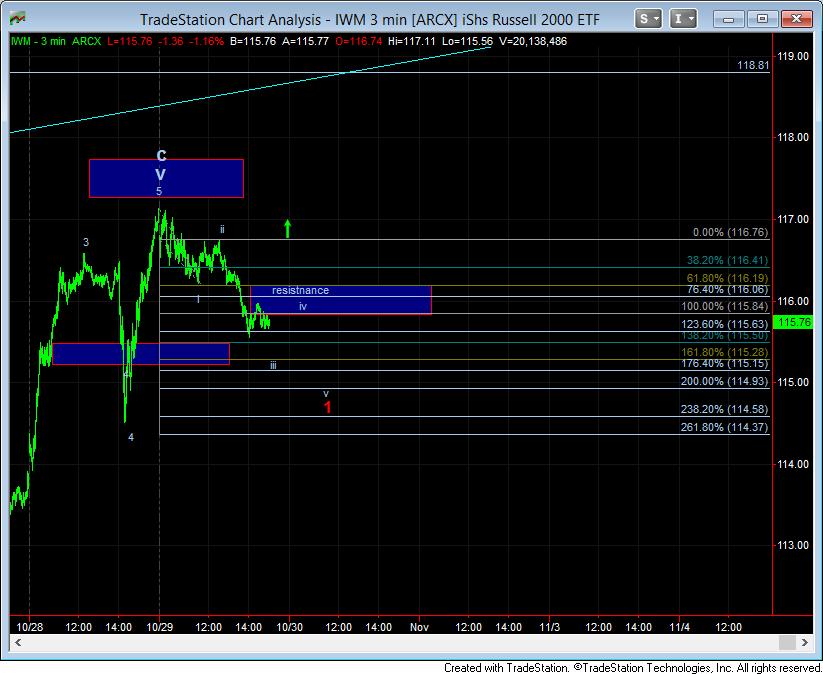
What I have counted right now is an (a)(b)(c) expanded flat in the daily chart, which remains below the broken trend channel. While it can rise as high as the 121 region and still remain valid, we have a micro set up right now which may suggest this has topped. In that micro count, all we have is 3 waves down. As long as the market remains below 116.20, the market can complete 5 waves down, and begin to point the market to the downside. However, should the market move through the 116.20 level, with follow through over 116.75, then it strongly suggests we are heading up towards the 121 region.
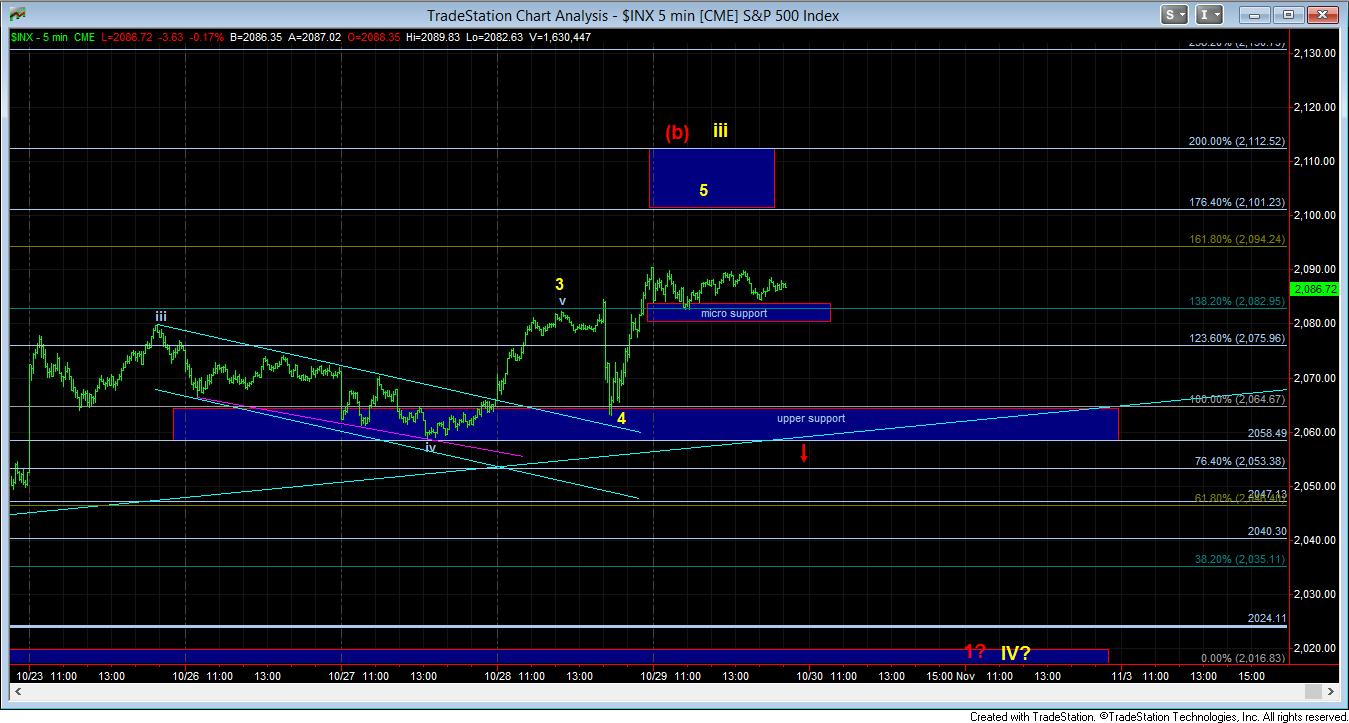
In the SPX, nothing has broken at this time, and higher targets still remain. I cannot begin looking down in the SPX until 2065SPX is broken, with follow through below 2058SPX pointing us towards 2000-2020. And, until we see a break of at least 2082SPX, we still have higher targets on the chart.