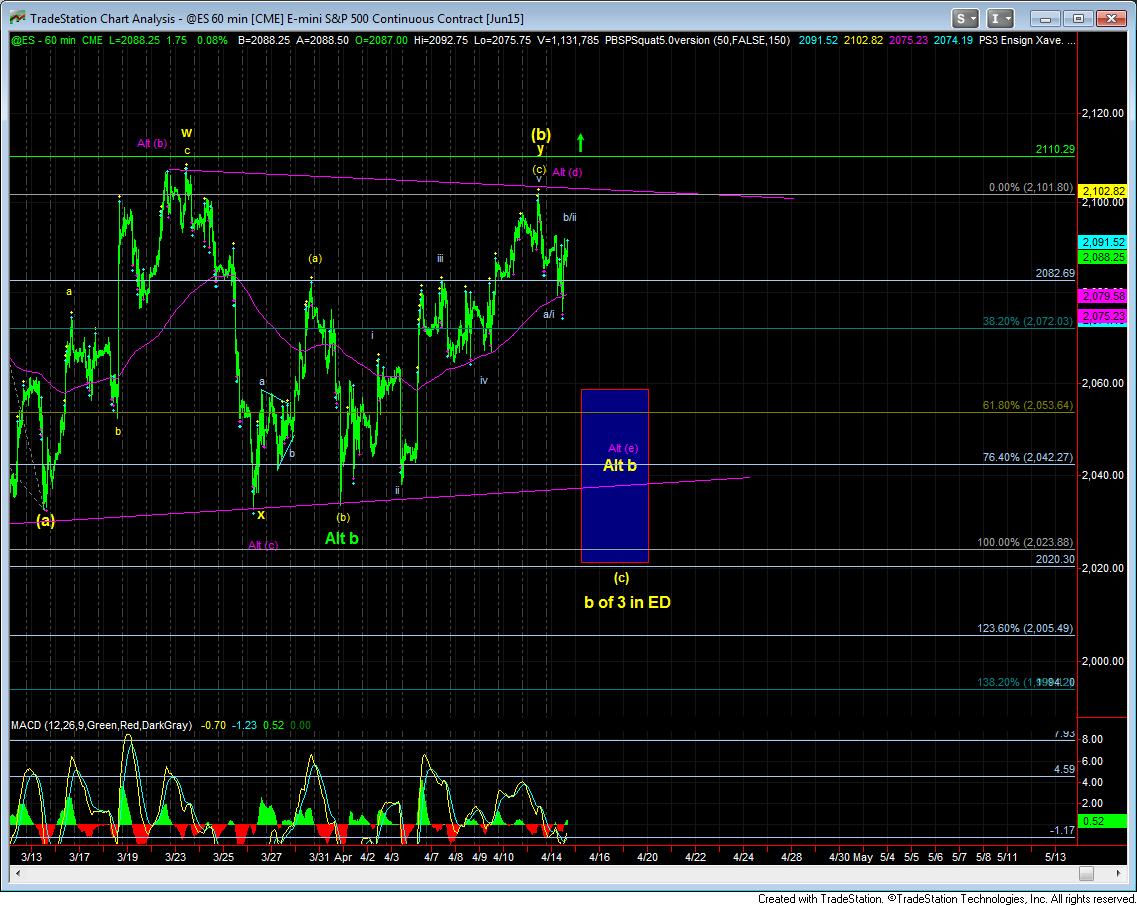
Was That Enough Of A Pullback?
Generally, my answer to the question posed above is “no.” However, I have to continually remind myself we are setting up a heart of a 3rd wave higher, and it is somewhat dangerous to be looking down. Yet, the IWM chart suggests that we really need a c-wave down for a wave ii. Furthermore, the ES has done nothing yet to convince me that a c-wave down will not be in store for it as well – that is, unless it makes a higher high over this week’s high.
As I noted last weekend, it will likely be this week that the market will make its decision about whether we go straight for the break out, or we set up our c-wave down. So, far, the c-wave down has not been taken off the table.
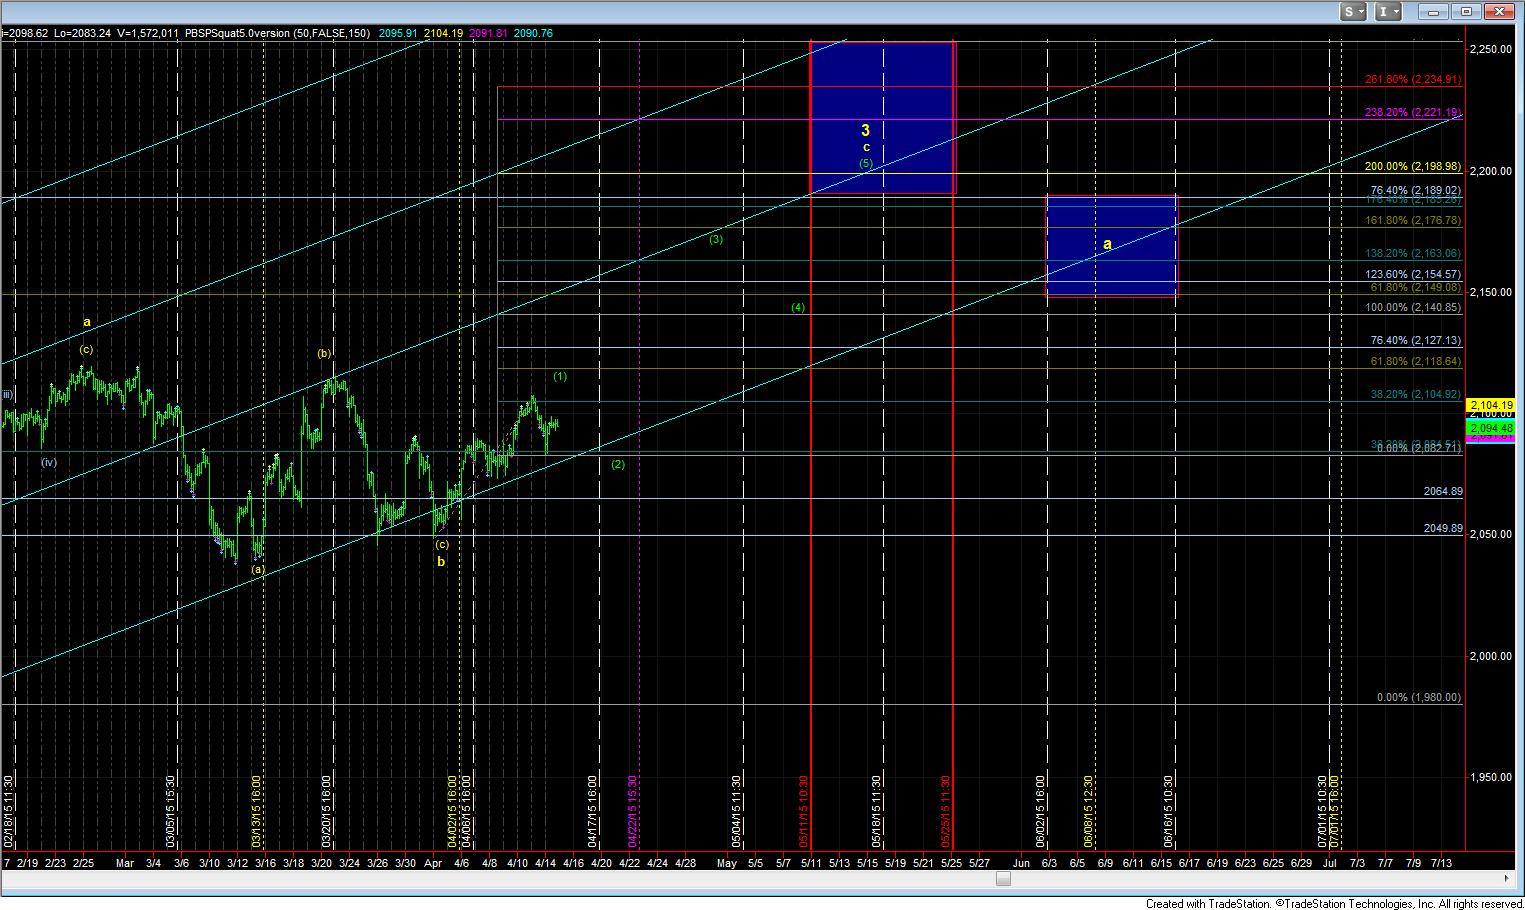
But, I would be remiss in not presenting to you the most bullish scenario on the table. As you can see from our timing chart, we bottomed right in our last turn window, and we could consider the rally thus far as wave (1) of the c-wave in wave 3 in the ES. Again, the pattern in the IWM is not as clearly suggestive of this potential, but it is hard to have downside expectations when the market is setting up for what likely will be a break out. Hence, I am honestly torn.
So, I have lowered my break out signal in the ES to a move over this week’s high being in line with Xenia’s, Zac’s and MikeG’s potential 5 waves off the early April low, thereby setting us up for a wave (2) pullback right into our next turn window which is between 4/17-22.
But, for now, as long as we maintain below this week’s high, we should be setting up for further downside into later this week. And, the question remains as to how deep that drop will be.