Volatility Picks Up But The Markets The Smaller Timeframes Remain A Mess
 By
By
Today the market opened higher and continued to push up into the afternoon session. That push higher was abruptly halted shortly after the lunch hour when we saw a fairly sharp drop lower thus leaving the smaller degree timeframe charts even messier than they were at the open. Now while they are quite messy the overall paths that had been noted over the past couple of days still remain intact and there is no change on the larger degree counts but with this sharp drop today we now have opened the door for a number of possible paths in the overnight and early morning trading sessions.
Green Count
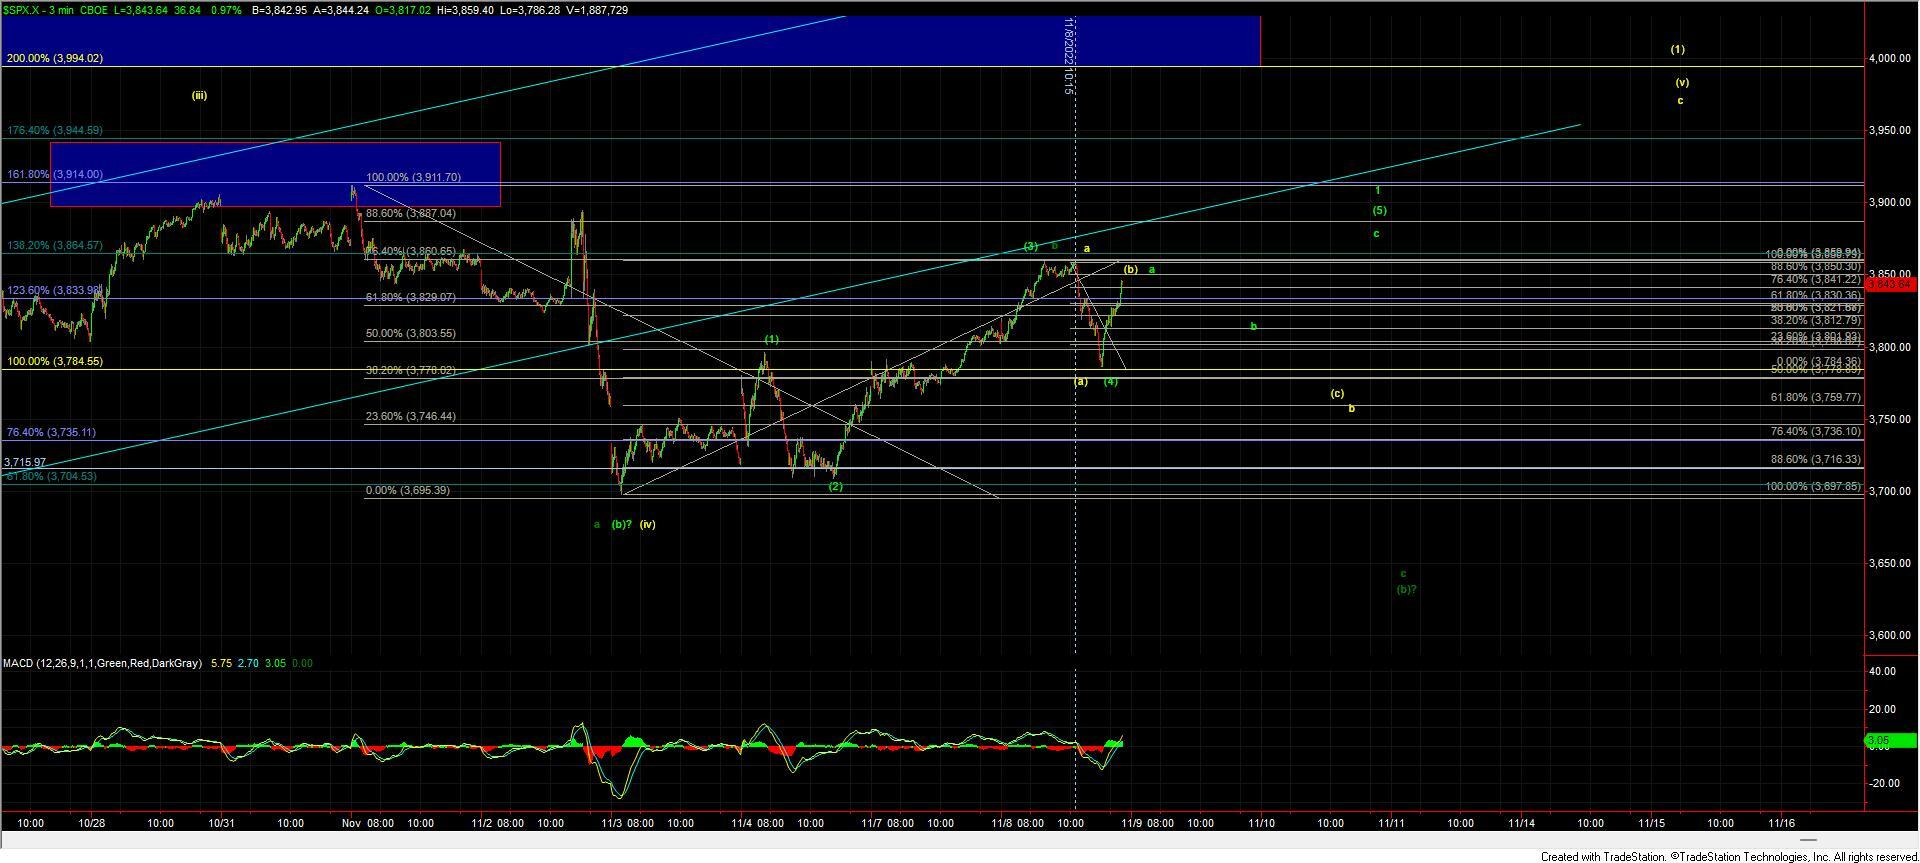
The green count would suggest that we are going to see a larger degree of a corrective move higher to finish off a wave b before heading lower under the October lows as Avi has been noting in his updates. Again there is no change to those larger degree paths or updates at this point in time. Today's action however did leave the door open to a number of different possible ways to get to that green count. Starting with what I am viewing as the most probable of the two the high today could very well have been the top of a wave (3) with the move down being a wave (4) before this bounce into the final hour of trading.
The depth of this potential wave (4) however makes it more likely that it is a wave (4) of a possible leading diagonal rather than an impulse. This will make tracking the move up more difficult as all of the price action moving to new highs will take the form of three waves. Under this case I would be looking for a wave a to top followed by a wave b down that holds the 3784 low followed by a wave c of (5) of 1 to new highs From there we should then see a retrace for a wave (2) followed by a strong push higher to begin the wave 3 of the larger degree wave (c) of b.
There is however a variant of the green count which I am showing in dark green which would suggest that the high today was the top of a wave b with this still needing a wave c of (b) down under the 3697 low before finding a bottom in that wave (b) and heading higher in the wave (c) of larger degree wave b.
Under this case, I would be looking for a strong break of the 3784 low followed by a break under the 3736 level and then ultimately under the 3697 low. Again this would setup a push up for the wave (c) of larger degre wave b before ultimately seeing a new lower low under the October lows. There are some issues with this path in regards to how it fits with the NQ as well as the structure down off of today's high however I will leave this path as a possibility until we break out back over the 3859 high on the SPX.
Yellow Count
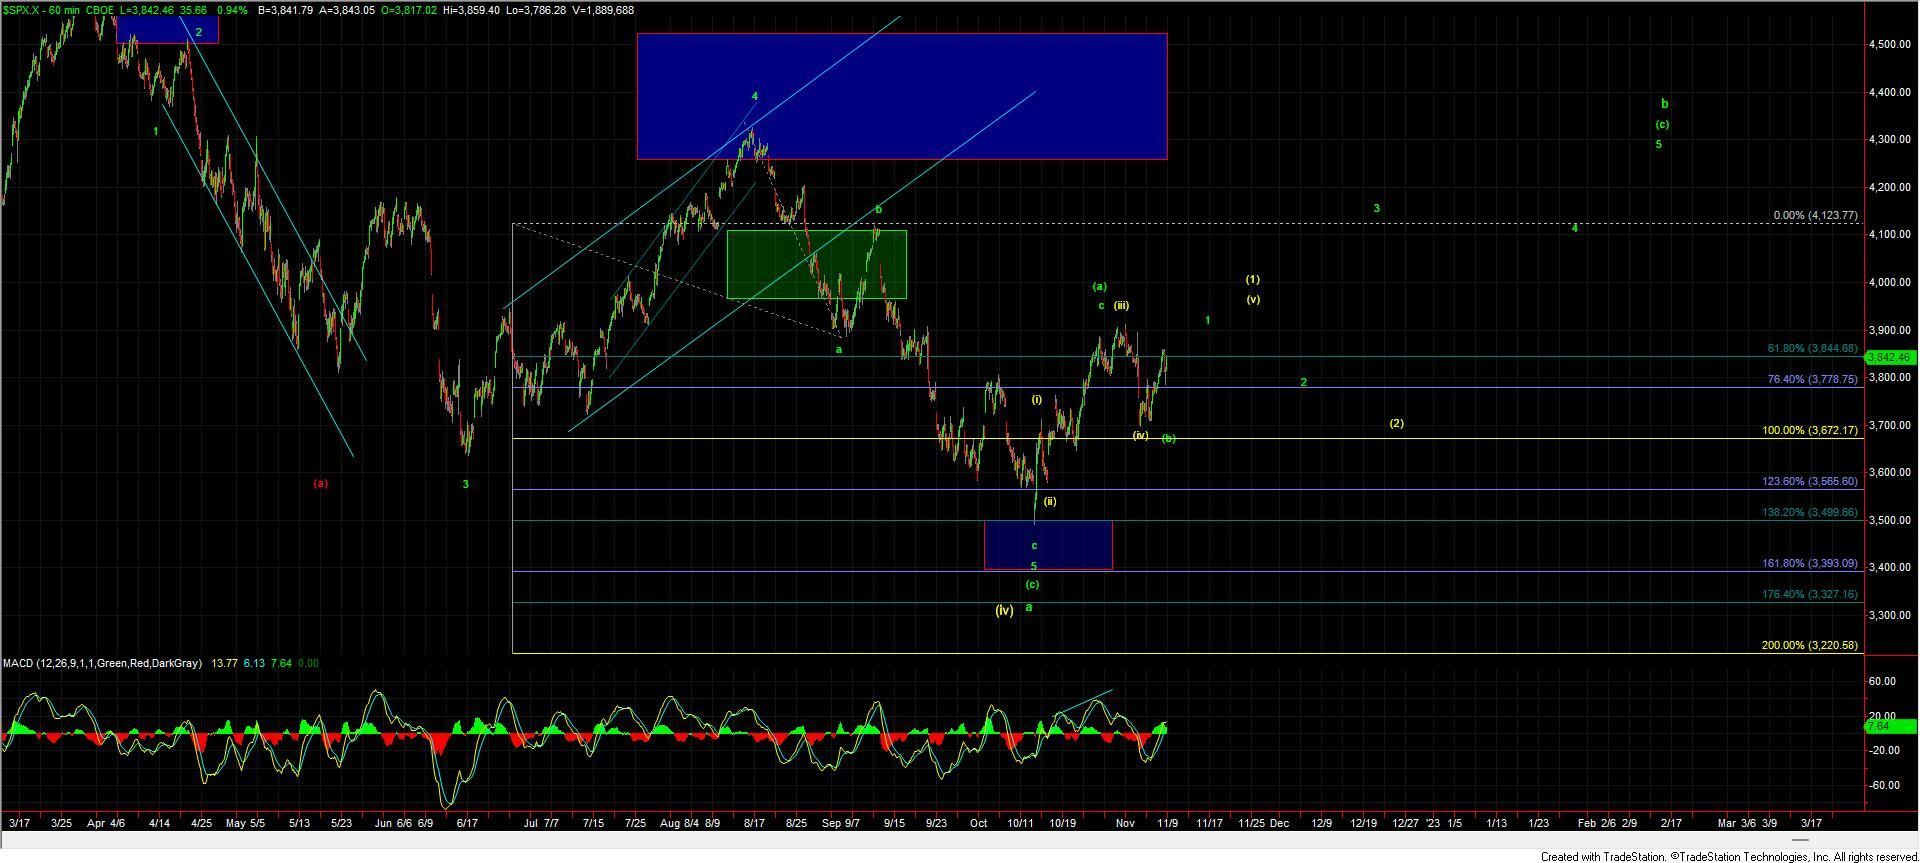
The yellow count still has the potential to take the SPX to new all-time highs but the structure is far from ideal on this path as Avi has been noting. Again larger timeframes have not changed on this and the only way at this point to keep this path alive would be to see a higher high from the 3695 low in the form of a leading diagonal.
Under this case, we should hold the 3859 high and then see a wave (c) of b down that should hold over the 3736 level and then another wave c of (v) of (1) up over the 3911 high. From there we should see a corrective retrace for a wave (2) that should then be followed by a strong wave (3) up with the potential to make it to new all-time highs.
This path has quite a bit to prove and until we actually see that wave (c) of b down followed by a push to new highs I have to lean towards the green count but I a certainly not ruling this path out given how sloppy all of the other paths are at the moment.
So while the overall counts on the larger degree timeframes have not changed today's action certainly did us no favors in cleaning things up. In fact, we are left with charts on the smaller degree timeframes that are sloppier than when we opened. On a positive note, we are getting fairly close to a point in which we will be able to eliminate some of these possible paths on the smaller timeframes which should help give us better guidance as to what the market is going to do over the course of the next several months. For now, patience remains key as we let the market dictate to us what path it is going to take as we continue to look for the high probability setups and opportunities in this otherwise sloppy price action.