Very Complex Update - Market Analysis for Feb 13th, 2023
I am going to start my update this afternoon with an apology. This is likely one of the most complex updates I have ever written, and it is due to the nature of the current posture of the market. So, especially for those new to our work, this may be difficult to follow.
About a week ago, the market told us that we were not going to see a standard Fibonacci Pinball structure for this [c] wave rally, which made it highly unlikely that the market was going to extend to the 4400+ region during this rally. It also told us to expect a whipsaw environment, as the market was likely trying to reach the conclusion of this [c] wave rally off the December low in an overlapping a-b-c structure within an ending diagonal.
You see, these structures we are tracking are quite variable and provide us with a lot of volatility. And, that is clearly what we have been seeing of late. Moreover, when our Elliott Wave analysis warns us of these types of environments, it tells us clearly to expect continued volatility and variability within the smaller degree structures. Therefore, it behooves most traders to become more picky in their trades, and to also reduce their position sizing.
But, in the meantime, even within these variable a-b-c structures, most often the c-waves break down into 5-wave structures. Yet, there are times where we do not see that final 5th wave to complete the c-wave. This is when the market morphs into a more complex and less common w-x-y pattern, which is almost impossible to know ahead of time. Rather, it is when the market takes out the pivot of resistance that it tells us that the w-x-y pattern may have completed the prior corrective structure.
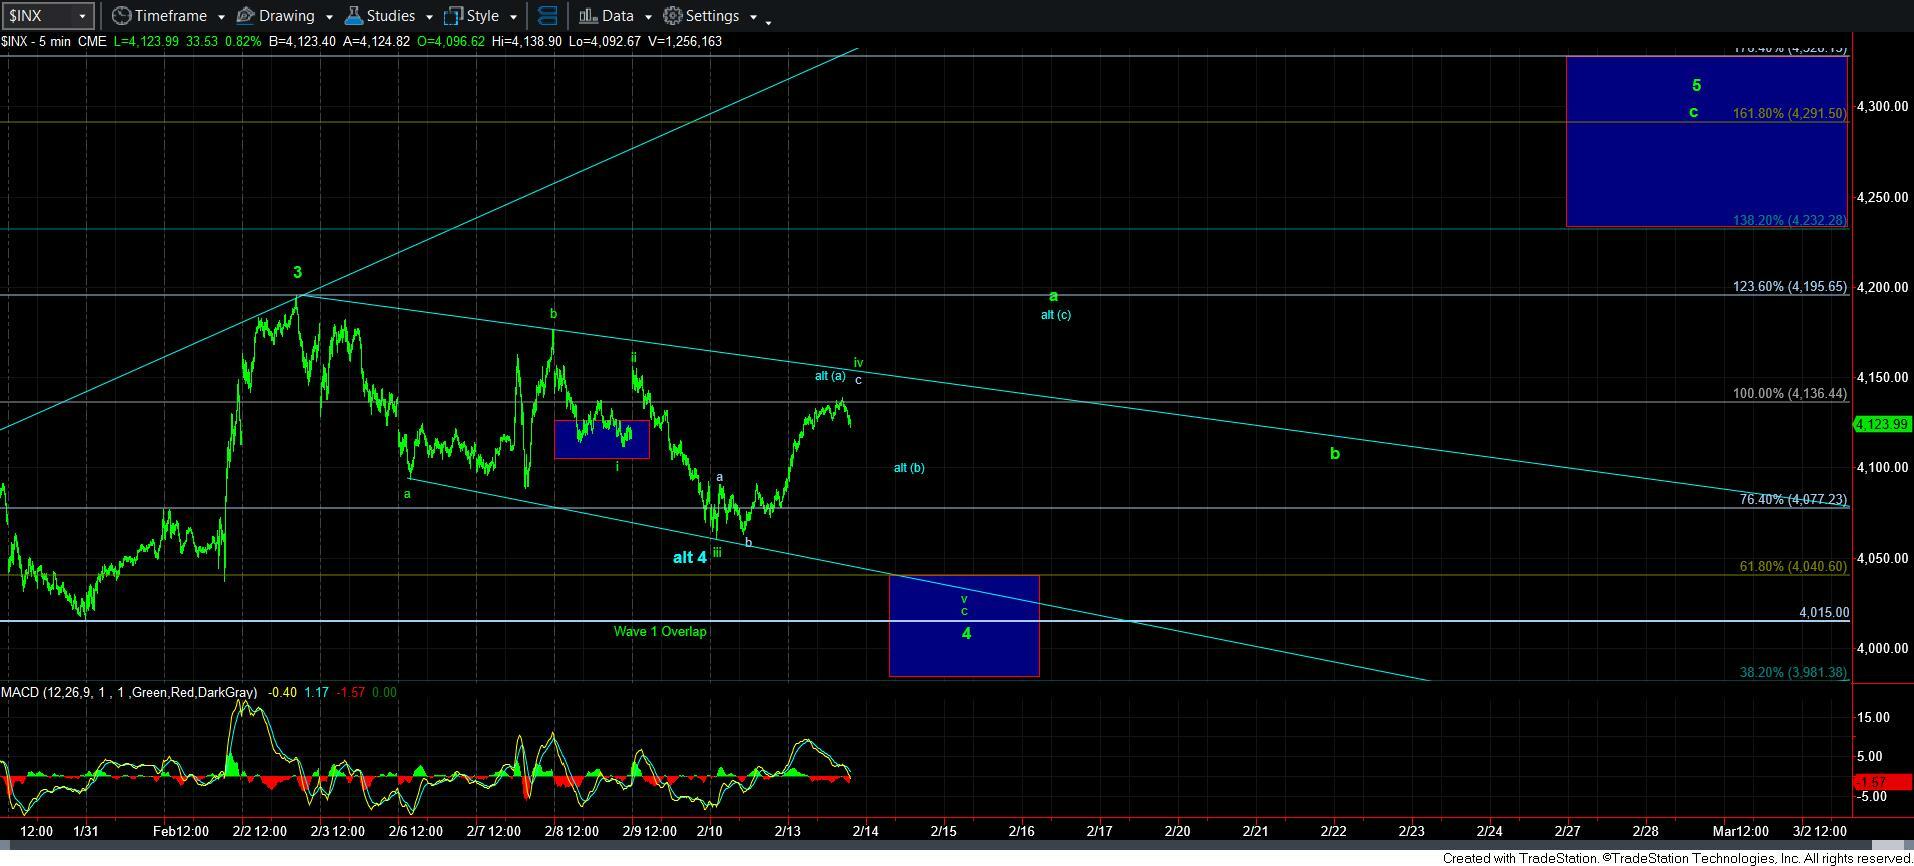
So, in our case, when we broke out over the pivot today, it certainly opened the door to the potential that the larger degree wave 4 of the ending diagonal rally off the December low has potentially completed in w-x-y fashion. This is labeled as alt 4 for now on the 5-minute SPX chart. But, I would probably say that the two options I am currently presenting on the 5-minute SPX chart are about 50/50 right now.
Before I begin discussing the two potential paths on the 5-minute SPX chart, I want you to take note that we are tracking both a larger degree ending diagonal pointing us to completion of wave 5 in the target box overhead on the 5-minute chart (within which we may have just completed wave 4) and a potentially smaller degree ending diagonal which views this rally as wave iv within that ending diagonal to complete a c-wave of wave 4 of the larger ending diagonal.
Now, allow me to explain the additional complexity brought to us by ending diagonals, which is why the 5-minute chart is so complex. The 5th wave higher high would take shape as an a-b-c structure within an ending diagonal. Furthermore, all waves within a diagonal take shape as 3-wave a-b-c structures, and a-waves are most commonly 3-wave structures rather than 5-wave structures. Therefore, the a-wave of wave 5 to the upper blue box on the 5-minute SPX chart would be expected to be a 3-wave structure.
Yet, if this is indeed an ending diagonal for the c-wave of wave 4 to the downside, then this rally would be wave iv within that structure. And, that, too, would take shape as a 3-wave structure. Therefore, it is almost impossible to distinguish this rally between the c-wave of wave iv in an ending diagonal for the bigger c-wave of wave 4 below us, or the start of the a-wave of wave 5. If you look at the 5-minute chart, I have tried to lay out these paths.
And, I am going to repeat myself again – this is a VERY complex structure in the smaller degree. To summarize, we are trying to distinguish between this rally being part of an ending diagonal to complete the c-wave of wave 4 to the downside, and whether it is the start of the a-wave of wave 5 in the larger degree ending diagonal off the December low, whereas both structures would be expected to take shape in an identical manner.
Unfortunately, the only way to be more assured of us already being in wave 5 to higher highs is by breaking back over the wave ii within the downside structure, which is in the 4156SPX region. This would effectively invalidate the potential of the ending diagonal structure to the downside.
I really hope my explanation has done some justice to your understanding of the complexity of the current region. If not, I do apologize. This is certainly not an easy micro-structure within which we are attempting to navigate.
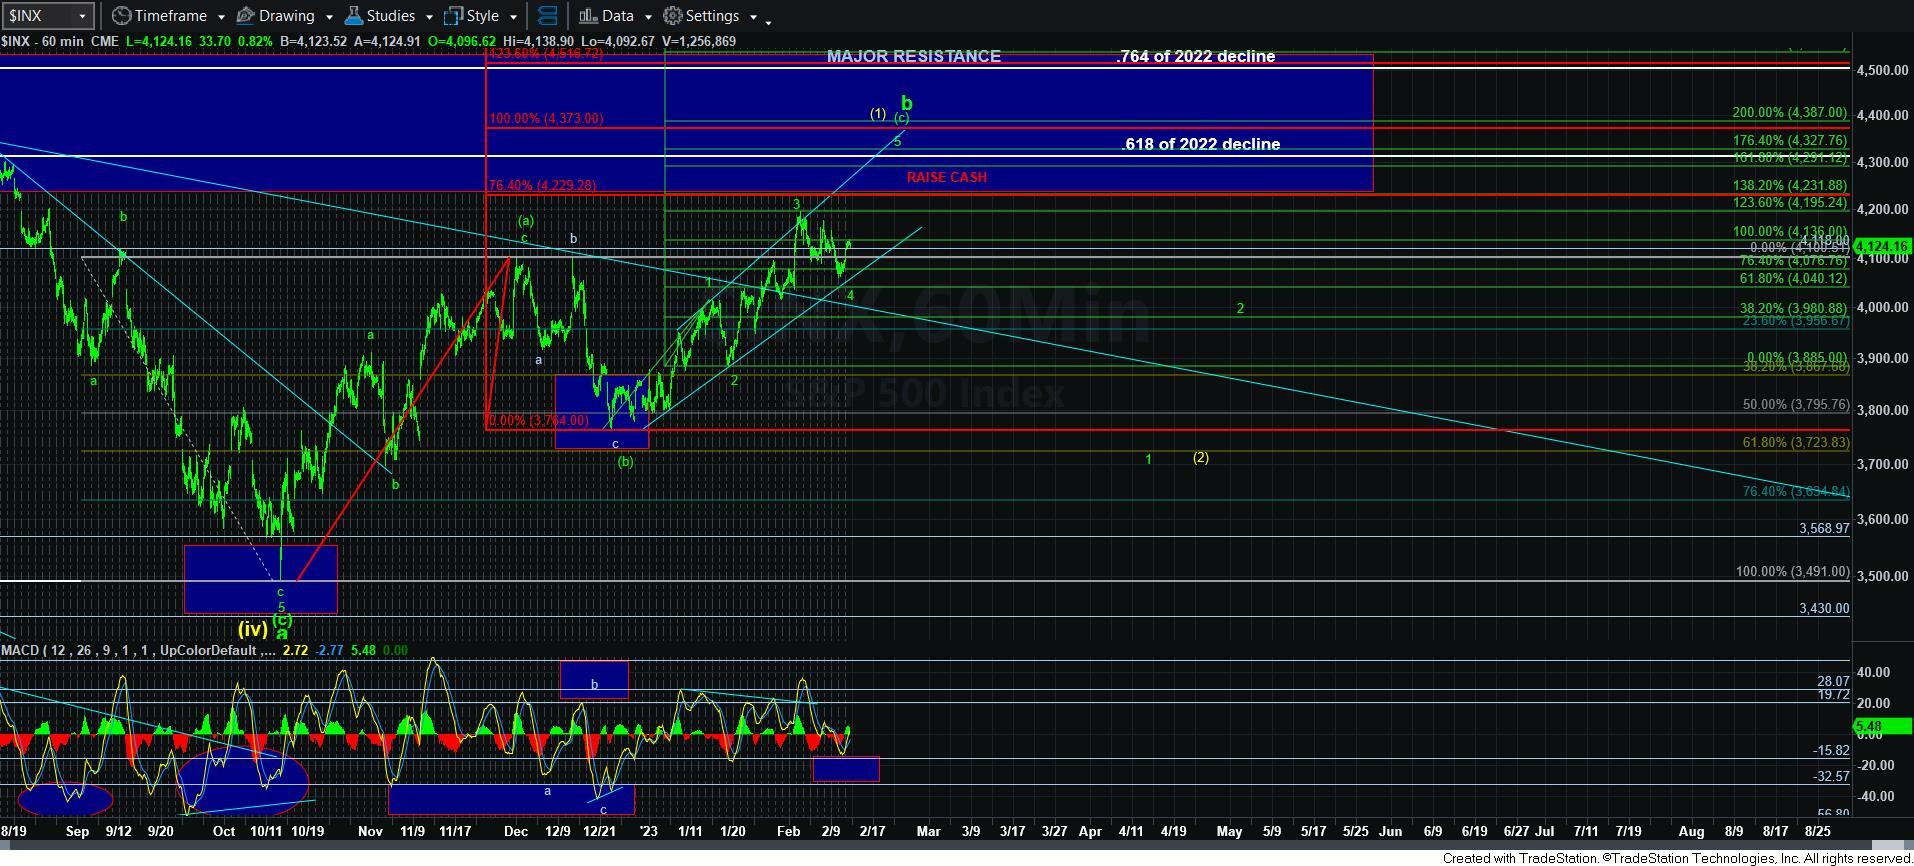
So, where does it leave us? Well, in the bigger picture, as I noted over the weekend, as long as we remain over the 3980-4025SPX support, I am reasonably expecting a 5th wave higher high to take shape within an a-b-c structure, as outlined on the 5-minute SPX chart. And, my targets have been outlined in the weekend update.
However, until we break out over 4156SPX, I have no strong opinion as to whether we can still see that lower low to complete an ending diagonal for the c-wave of wave 4, or if we have indeed begun the a-wave of wave 5. While I could certainly pick a side, I want to be honest with you.
But, it certainly does present us with a pattern which would provide a significant amount of volatility potential over the coming days.