Upside Has Been Very Sluggish
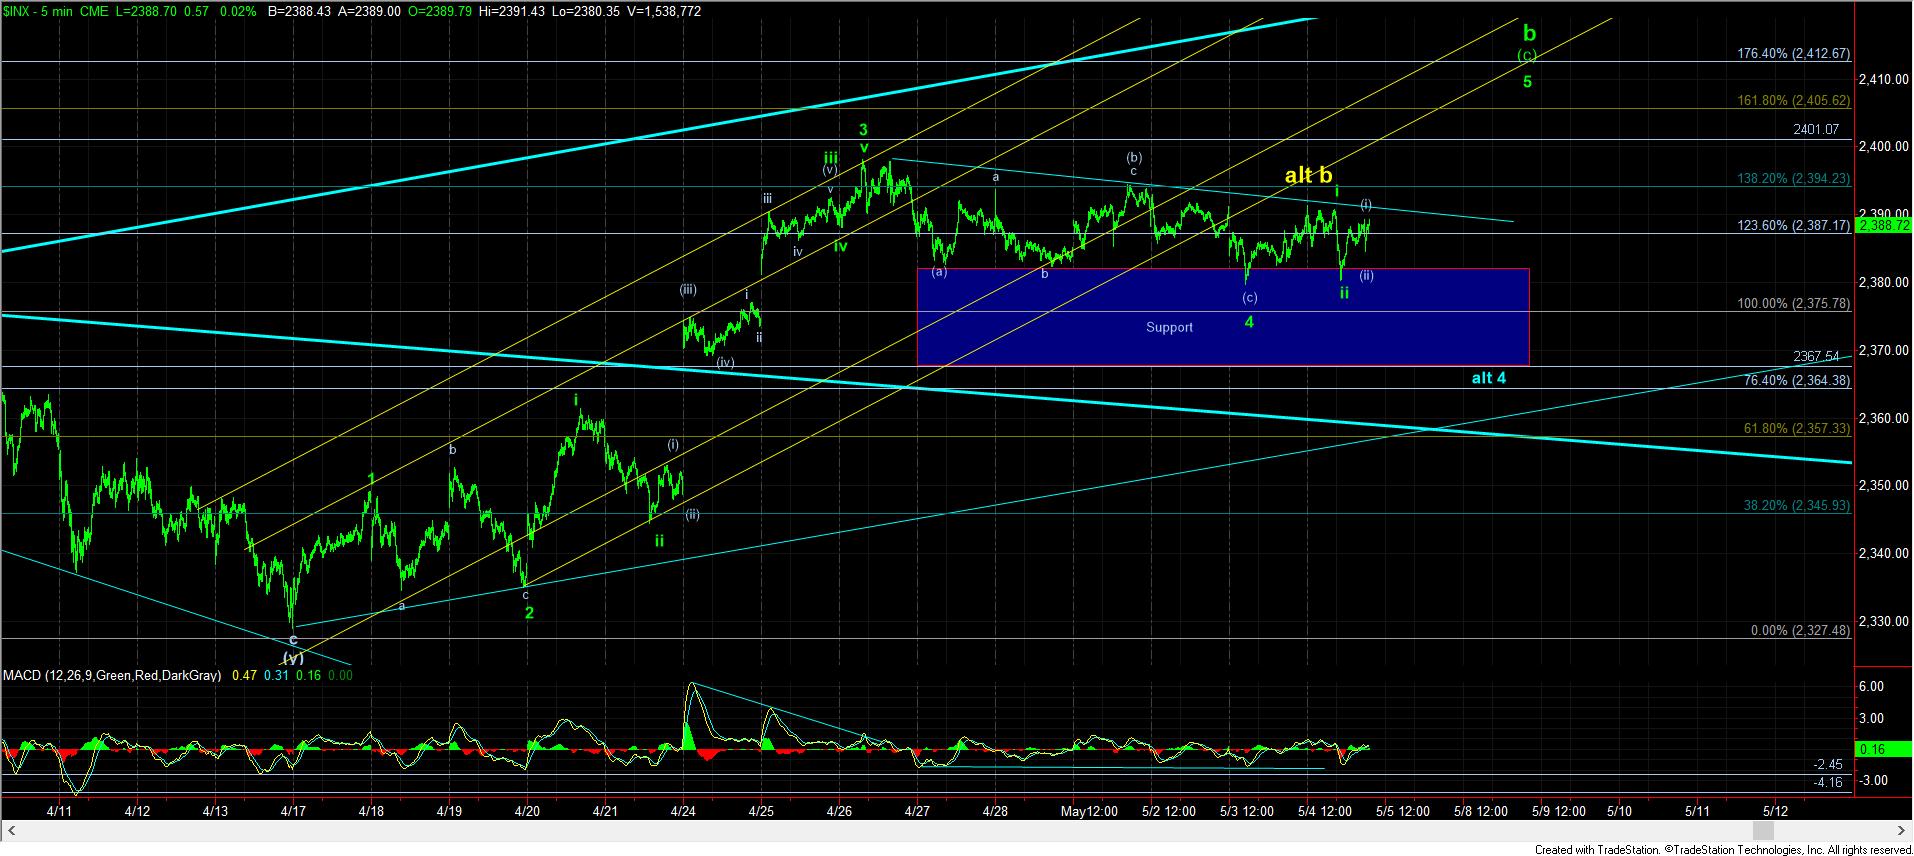
Sideways action is often the most difficult to deal with in the market. To that end, it is often hard to discern where a 4th wave ends, especially when the structure is not clear. That is what we have been dealing with this week.
The bottoming in green wave 4 as presented on the chart is not the cleanest of structures. Moreover, the move up off that low was also quite overlapping. But, based upon the bigger structure, we would almost have to assume that the market is now set up in a i-ii, (i)(ii) structure, about to break out in wave 5. It would take a break down below today’s low to suggest otherwise.
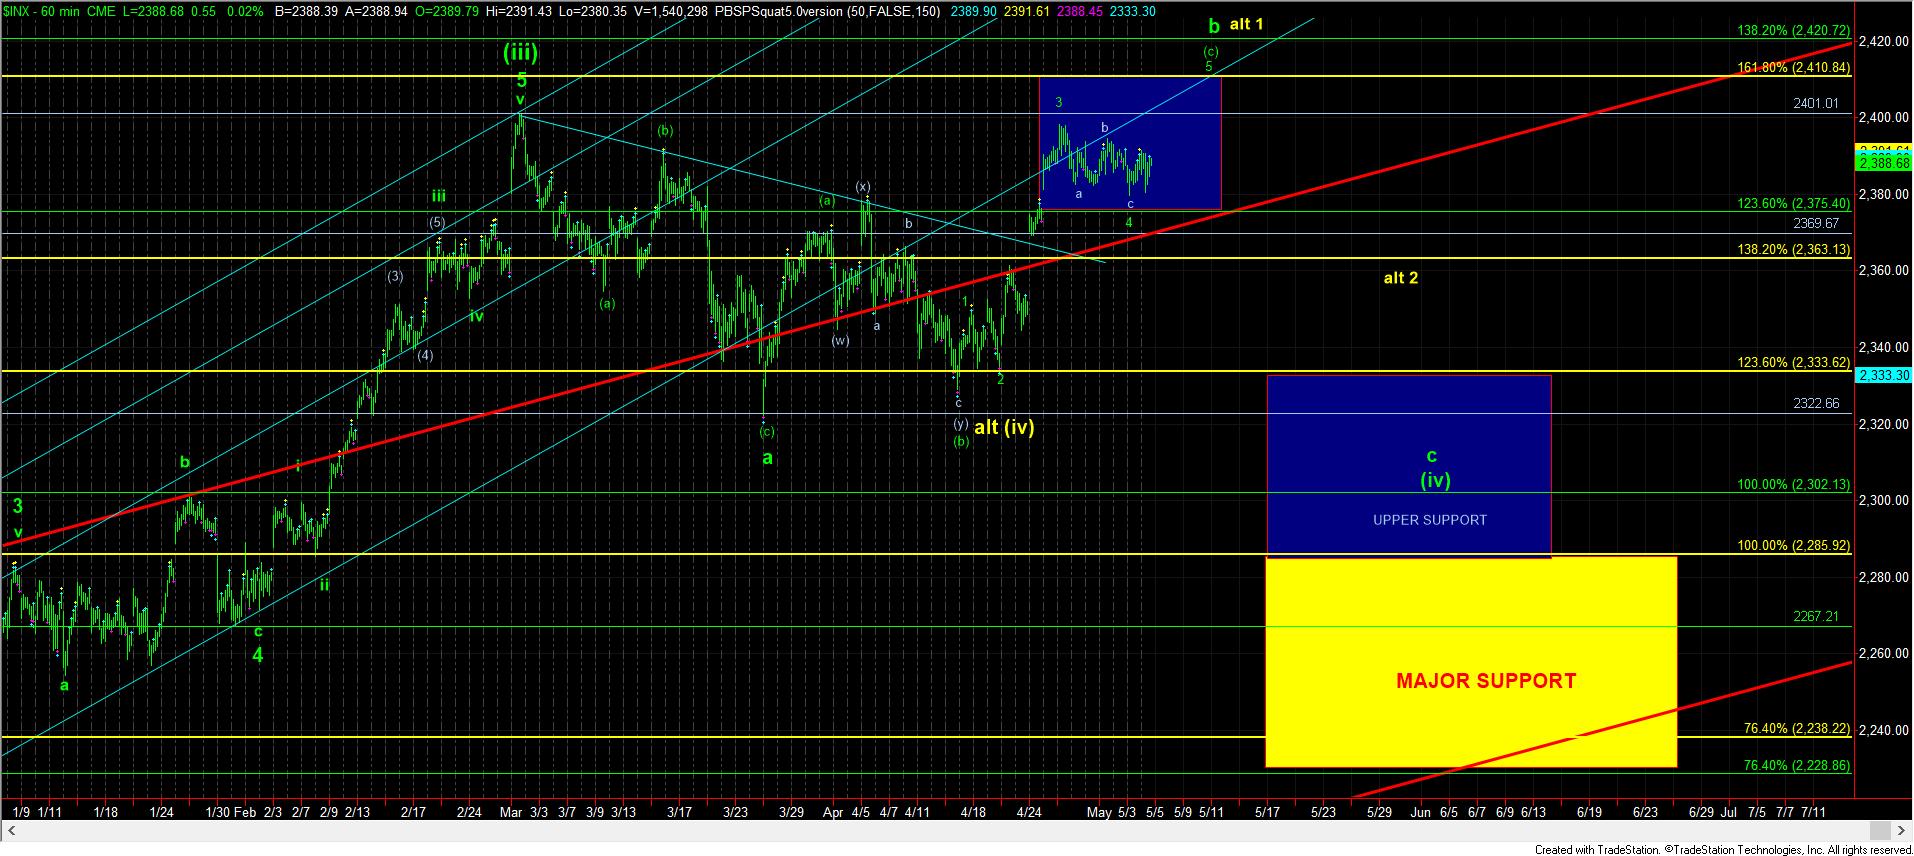
As long as we hold today’s low, I am looking for an immediate break out to complete wave 5 of (c) of b of (iv) on the larger time frame. However, if we should break today’s low, then we have to watch support at 2367-2370 (yes, I had to drop it by 3 points) to determine if the b-wave has actually been struck in a more unorthodox and truncated fashion.
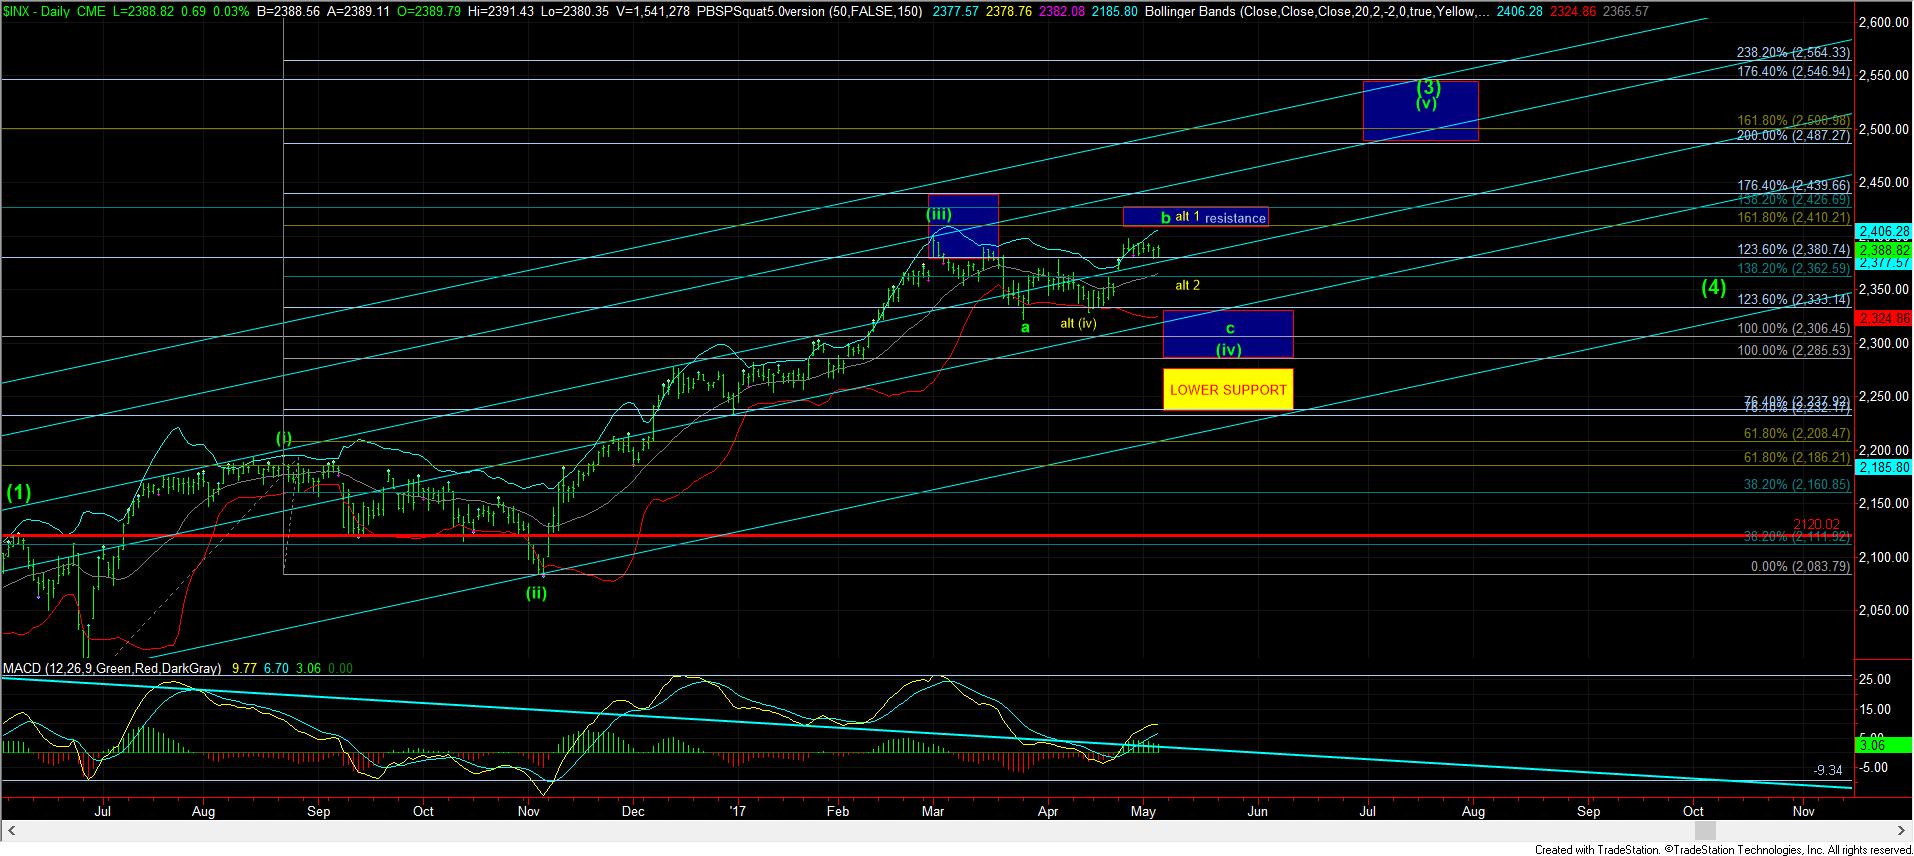
For now, my preference is still to see a rally up to the 2410SPX region, but I still believe this will only be a b-wave high, followed by a strong c-wave down to complete wave (iv), before we set up to rally in wave (v) to the 2500SPX region.