Upside Follow Through - Market Analysis for Aug 23rd, 2016
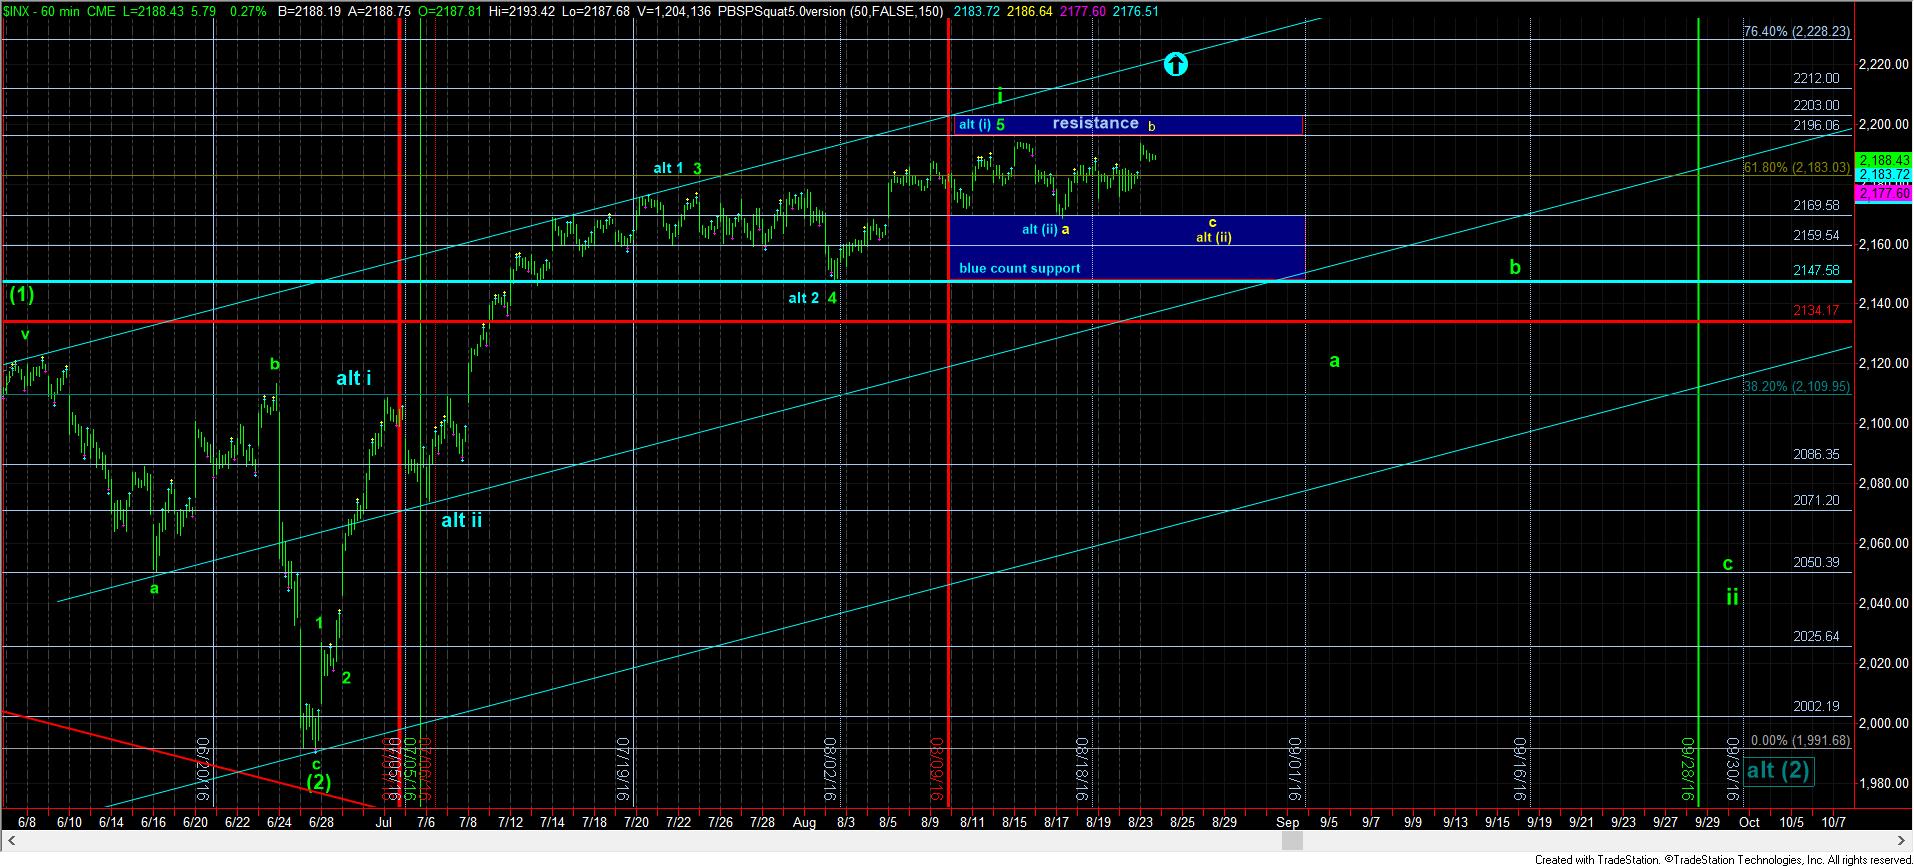
While the market did break out to the upside as we expected, the market did not complete the larger triangle I had ideally wanted to see before this break out. As I noted in an update I sent out in the evening yesterday, the immediate bullish case is resting upon a VERY RARE wave (ii) structure as a WXY pattern, with a y-wave triangle. Again, these are extremely rare, and this may be only the 2nd one I have ever seen in real time if indeed this does break out.
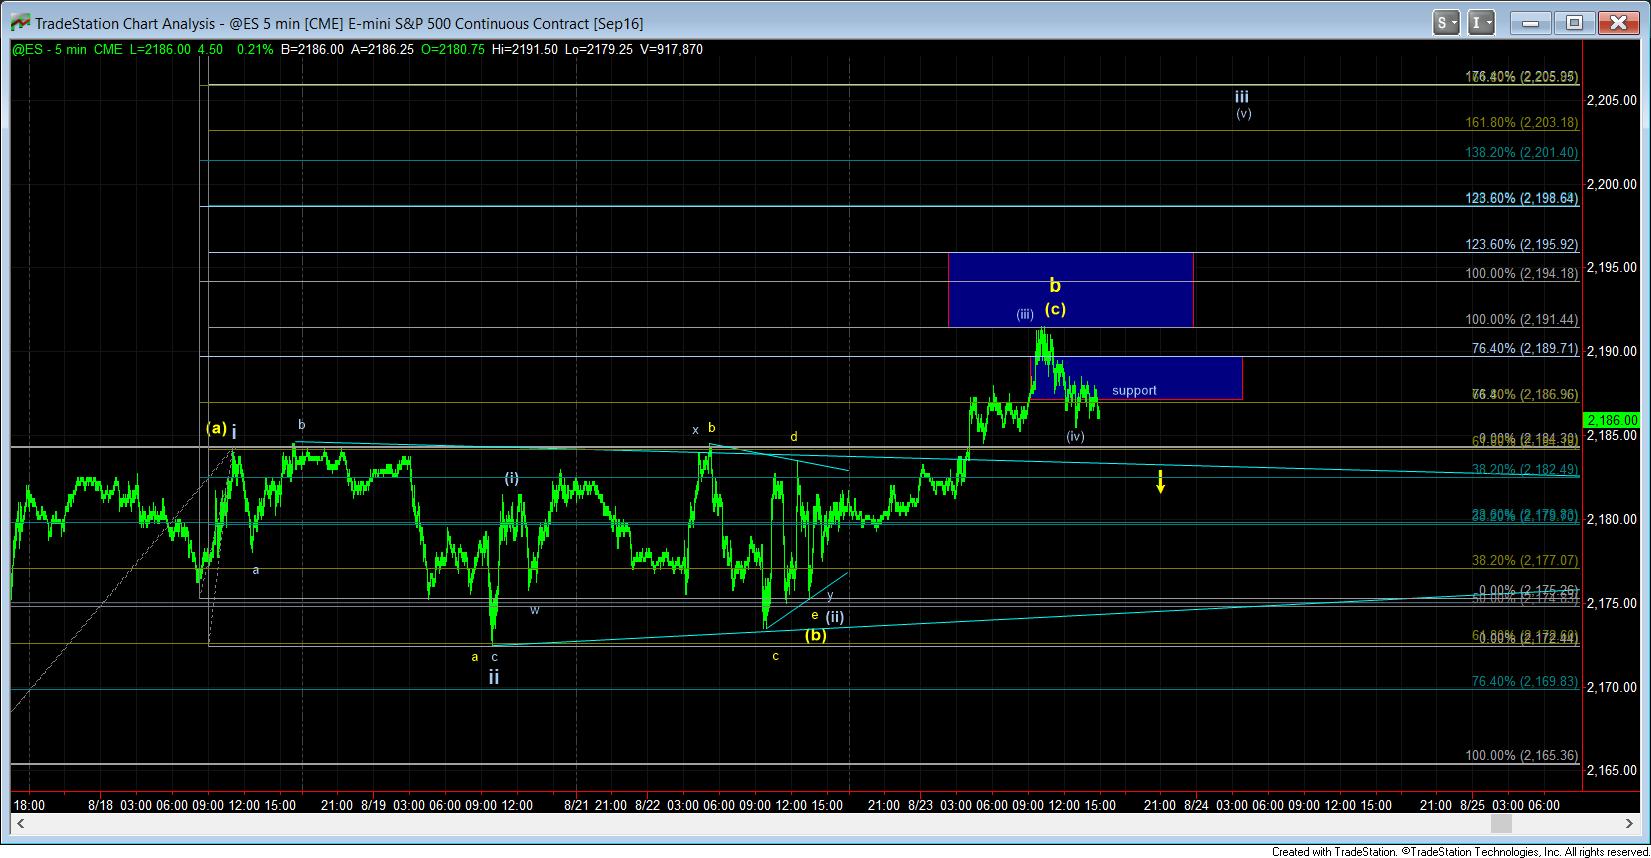
So, again, the probabilities reside with this being a corrective b-wave rally, as long as we remain below resistance, and, ideally, below today’s high. In this pattern, the yellow count points us down towards the 2170SPX region in an almost perfect a-b-c flat pattern. And, as noted the other day, this can either be as a more expanded wave (ii) within the blue count, or it can simply be the start of the correction in the green count.
But, in the meantime, the market is still stuck between support and resistance. While the immediate bullish count is quite rare, I am not going to fight it if we should see a continuation of this rally with a gap up in the morning over today’s high. If that occurs, the we are targeting the 2201ES region, and it has the bulls in very strong control of the market.
With regard to the yellow count, the market must break down below 2186ES, with follow through below 2184ES to begin the drop towards 2170SPX.