Upper Support Is Being Tested
I wish there was some incredible insight I am able to provide to you this evening, but, to be honest, just looking at the attached 5-minute chart will tell you the whole story.
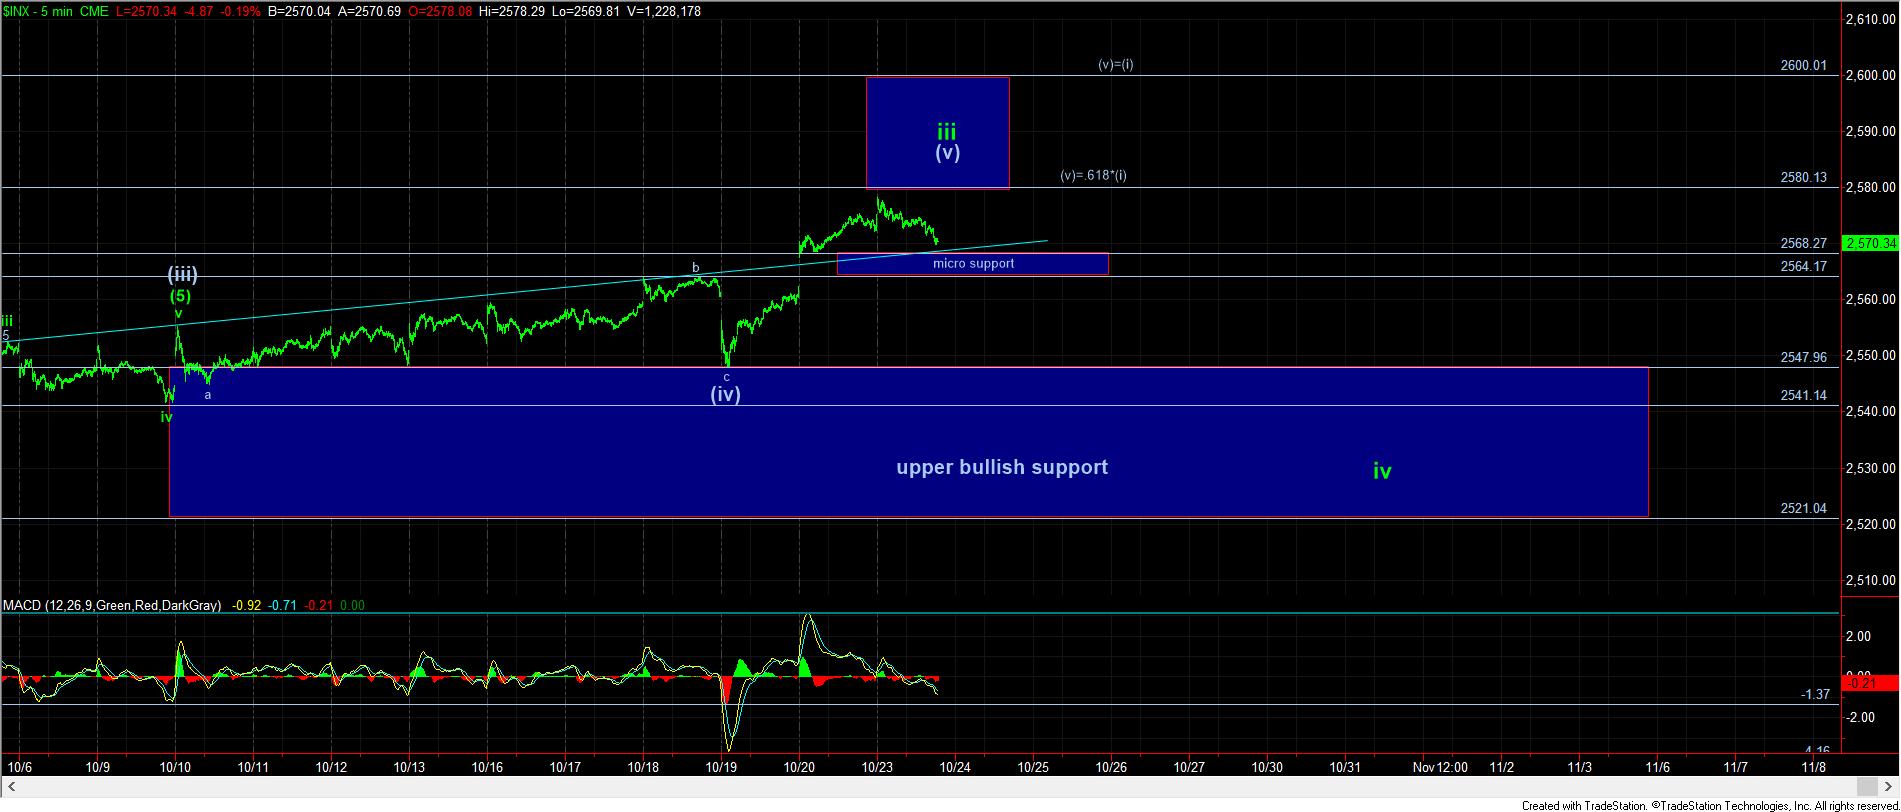
As you can see for yourself from the chart, we are now back-testing the point from which we saw the break out last week. Support now resides between 2564-68SPX, which is also just below the trend line from which we recently broke over.
Clearly, as long as the market holds this support, we will see another run at the 2580SPX region to complete wave (v) of iii. It will take a break of this support region to provide an initial indication that wave (v) of iii has completed, and green wave iv has begun.
So while I am looking for a 30+ point pullback in green wave iv, we still have no clear indications that it has yet begun. Moreover, even after we see that pullback in green wave iv, it still suggests that the uptrend has not yet completed, as long as we remain over the 2520SPX region.
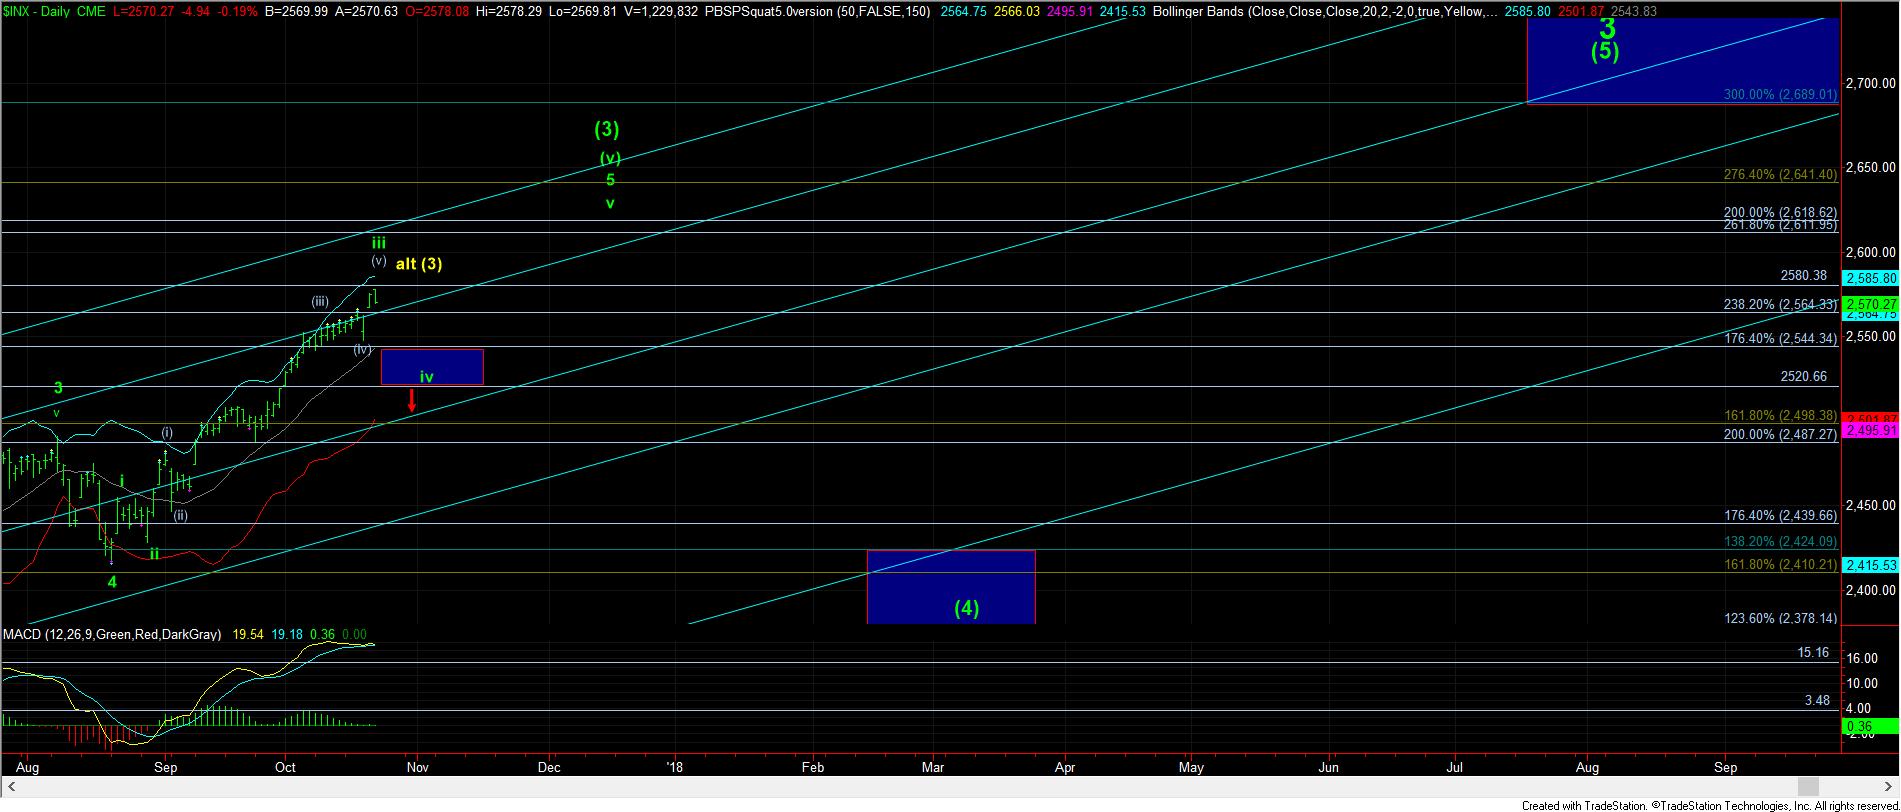
So, please remember that we are still in a bull market, and the market seems to still have its sights on the 2611SPX region later this year.