Understanding Our Environment - Market Analysis for Feb 3rd, 2022
A person must understand their limitations, as not a single one of us is all knowing. And, knowing what you don’t know is actually powerful knowledge in and of itself. So, not knowing whether wave [4] is truly done is powerful information in and of itself, as it provides us with a healthy respect for another potential downside move. In fact, it made it rather easy to see yesterday’s rally was approaching a high from which we would likely see lower levels before this market makes its decision. But, the bigger question really is still if we can see a lower low in wave [4] or not?
As I also noted this morning:
“I am sure some of you may be frustrated by my inability to be more definitive about the turning points and where we are in the current smaller degree structure. Those that have been with us for years know that during a standard Fibonacci Pinball structure, we can identify the market turns quite accurately on the upside and downside during the movement. But, this structure is not a standard Fibonacci Pinball structure on both the upside and downside within its internal structure. For this reason, I have to be more cautious and patient as the market makes its decision between blue and green in this region. And, when this clears up we will have a much stronger picture as to the path to 5500SPX.”
So, I want to remind you what Frost & Prechter noted in The Elliott Wave Principle:
“Of course, there are often times when, despite a rigorous analysis, there is no clearly preferred interpretation. At such times, you must wait until the count resolves itself. When after a while the apparent jumble gets into a clearer picture, the probability that a turning point is at hand can suddenly and excitingly rise to nearly 100%.”
Now, even though I am unable to provide you micro-wave structure guidance as accurately as I normally do, there is also powerful information to be gleaned in understanding where the market resides in the bigger picture. And, as I say so often, the only analysis methodology I know of that can provide you with market context is Elliott Wave analysis.
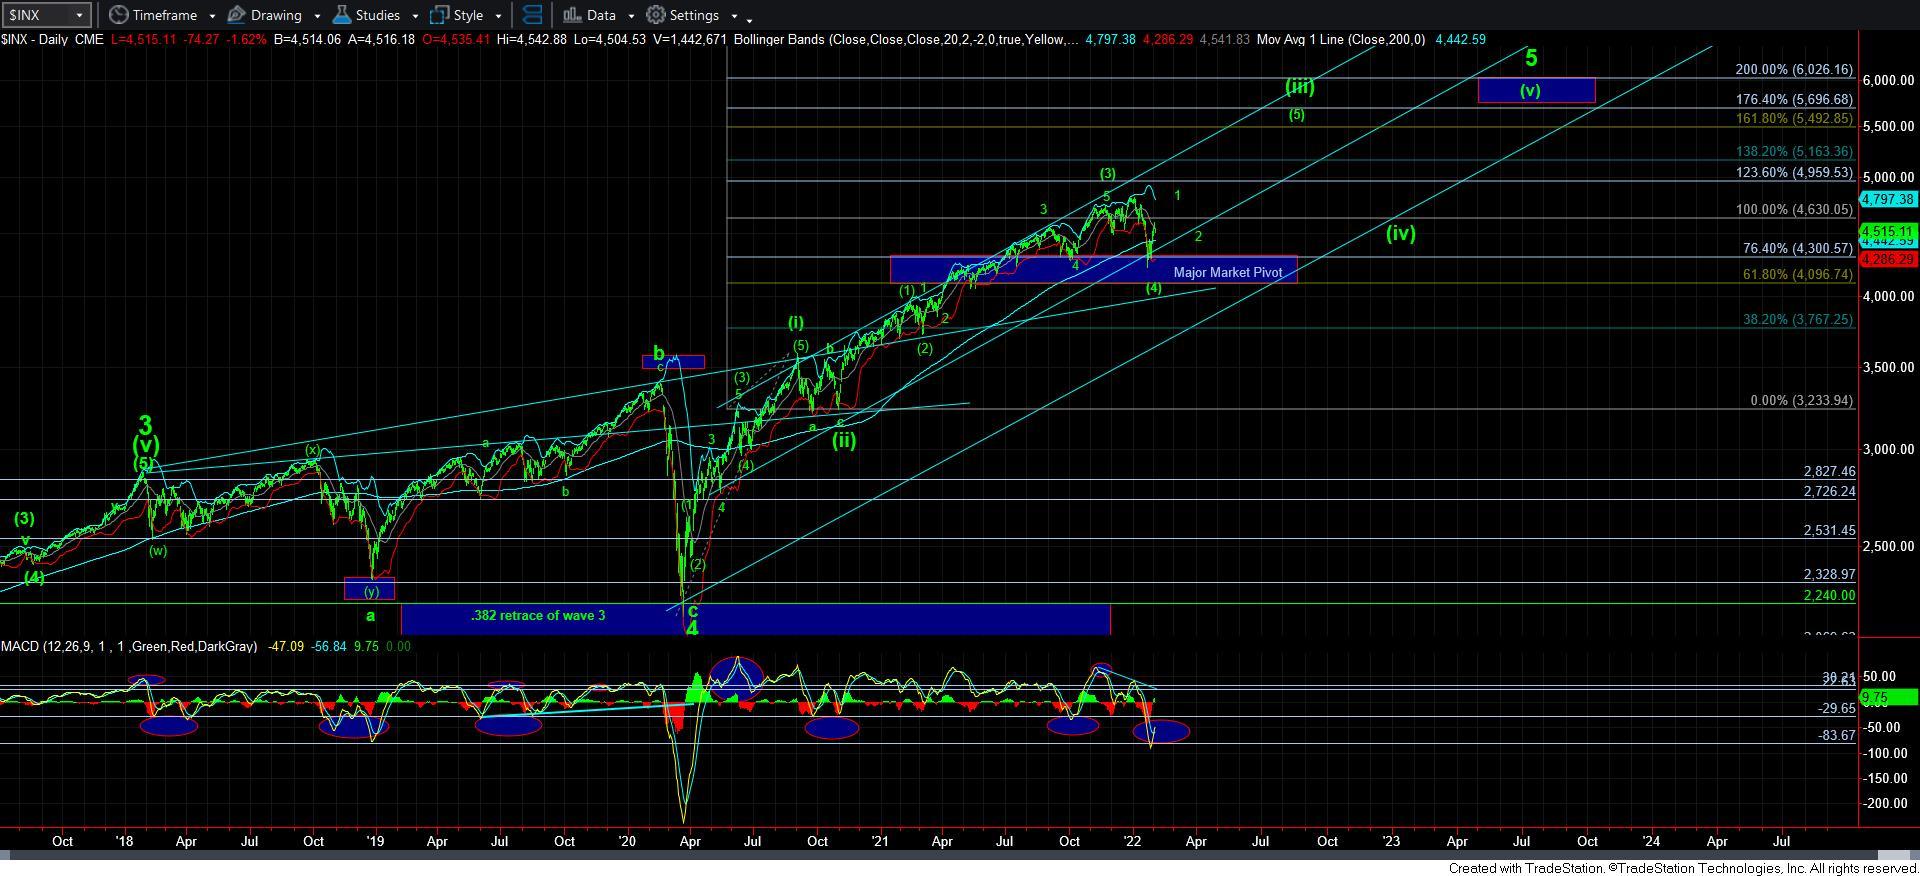
To this end, the market is clearly telling us it is trying to prepare us for a rally to the 5500SPX region to complete wave [5] of [iii] off the March 2020 lows. And, as I outlined in my video yesterday in great detail yesterday, the market context provided to us by our Fibonacci Pinball structure to date since we bottomed in March 2020 has been outstanding. It has told us when to remain strongly bullish, and when to begin preparing for a pullback. And, as the market is now trying to decide whether it is ready to begin its next major multi-month bull phase in wave [5] of [iii], it has given us a number of opportunities to reposition for that rally.
So, this morning, I put out the following post to outline my view on the micro structure:
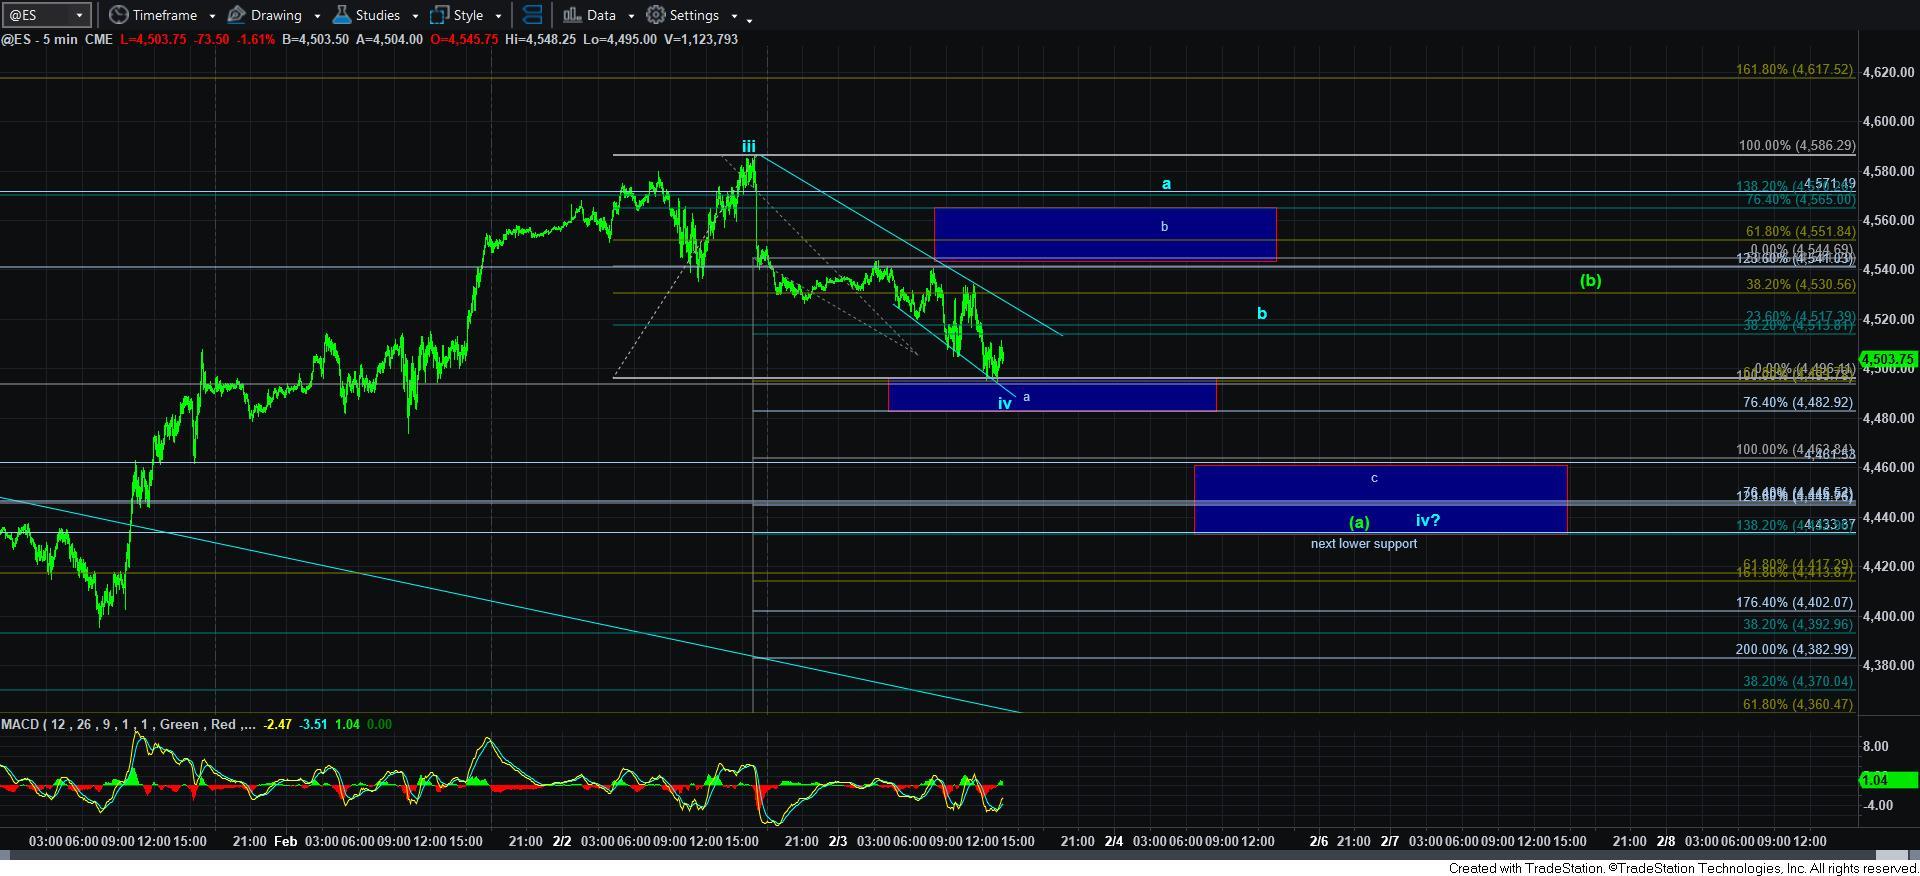
“Are we heading down or up? Well, look at the 5 min chart. The problem is that we are dealing with 3 waves in each direction for now.
So, if this drop finds a bottom, is it the (a) wave to start a decline in the final wave V in green in the ending diagonal (which will be an a-b-c move in that 5th wave in the ending diagonal), or is this wave iv in blue which leads to a new high?
The problem is that every move off a support we hit on this decline will be a 3-wave structure. So, we will not be able to distinguish between the next rally being a (b) wave in green - leading us lower - or an a-wave in blue, pointing us ultimately higher.
THIS is the issue with which we are going to grapple.
Under normal circumstances, trading out of a 4th wave into a 5th wave is hard enough. But, often we see a 5-wave c-wave completing, followed by a 5-wave rally off that low to tell us that wave (4) has ended and wave (5) has begun. Not in this case. We do not have a clearly defined 5 wave bottom, nor did we see a clearly defined 5 wave rally off the low. Yet, each and every bottom since the March 2020 low has been an unorthodox bottom and we have not seen the usual 5-wave decline followed by a 5 wave initial micro rally off that low.
Herein lies our conundrum for the next few days. But, I would say that a solid and sustained break of the 4400 region will likely point us down to a lower low.”
Moreover, throughout the morning, I continued to provide warnings that we have again moved into a whipsaw environment due to where we are in the wave structure, and knowing your environment is half the battle of trading/investing:
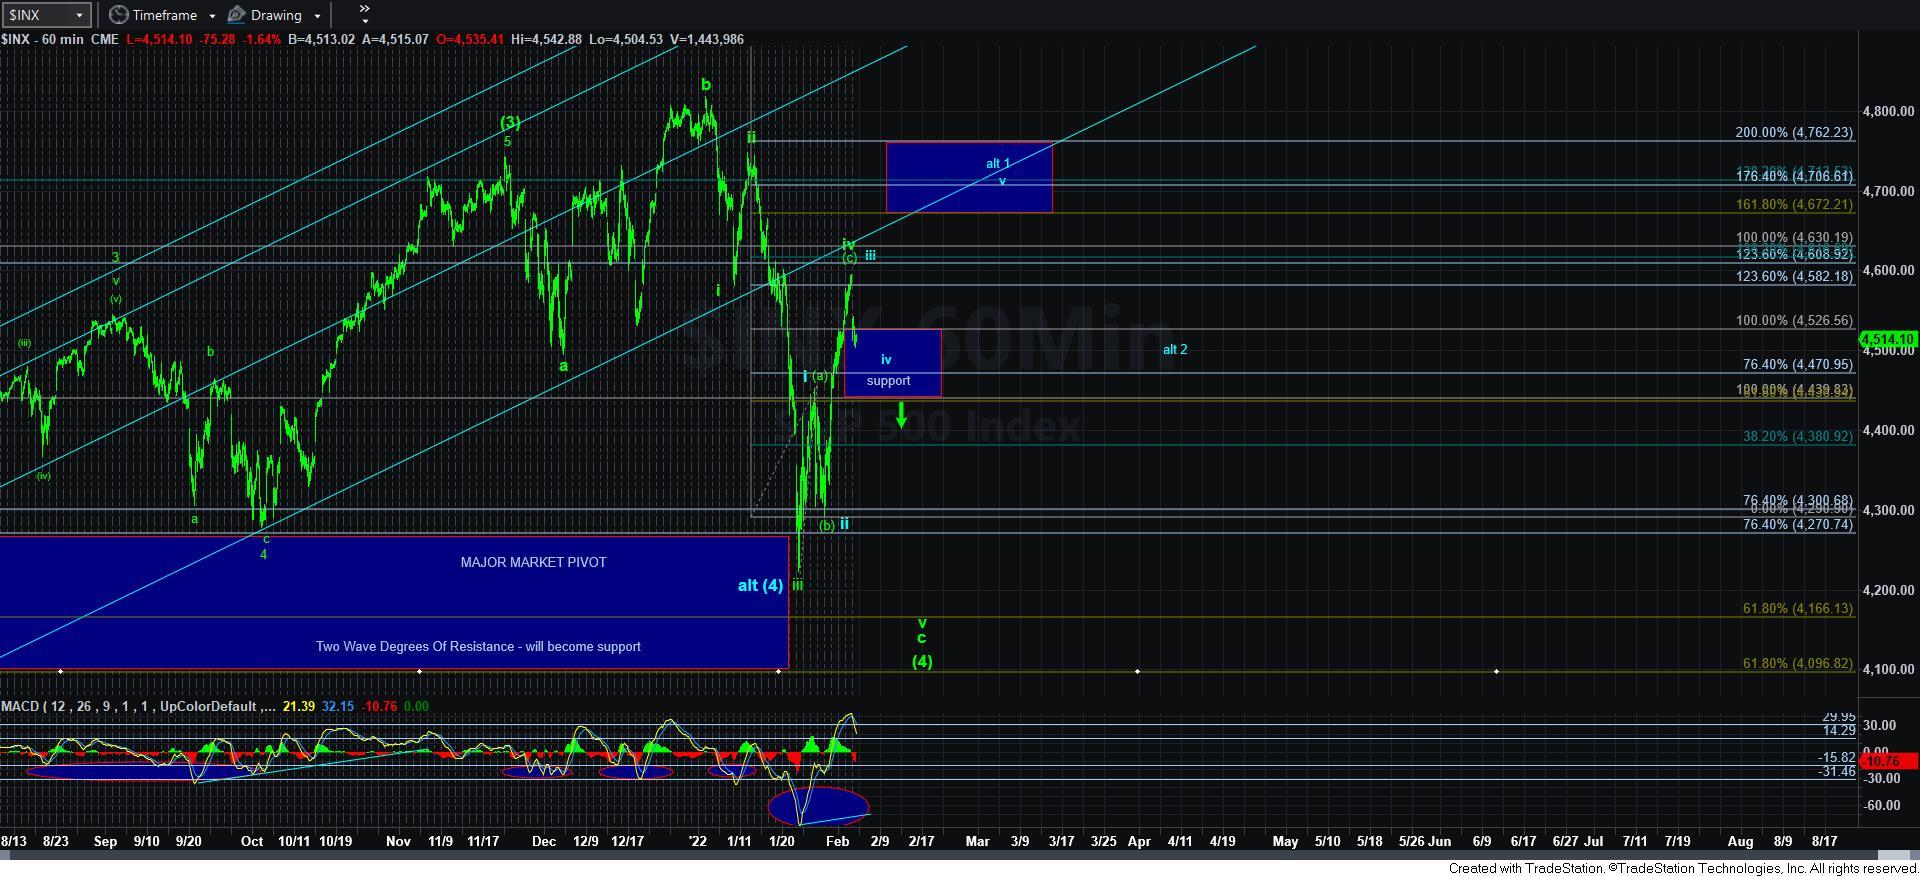
“We seem to have made it to the top of our support box quite rapidly. But, keep in mind, this is a large support box of about 80 points. The reason is we can even allow a retest of the 4440 region which would provide for the overlap normally seen in a leading diagonal with waves i and iv, and still be able to get a higher high in wave v. So, until further notice, please expect more whipsaw. This is now only an environment for very nimble traders, and even they will likely get nicked a time or two . . at least. Know your environment.”
So, I am going to provide you with a micro count on the ES chart, but with the warning that it is entirely reasonable for us to see a more direct break of the upper support box earlier than I now expect. Remember, attempting to glean an exact path within a corrective move is akin to through jello for distance. But, nevertheless, I am providing a proposed pattern as to how this pullback can still continue to take us down to the lower support on the 5-minute ES chart, which is the lower end of support on the 60-minute SPX chart.
The main point to glean right now is that as long as we remain below the blue resistance box overhead on the 5-minute ES chart, we will likely target the lower blue support box. However, if we are able to exceed that resistance region overhead, then it becomes likely that we rally to a higher high and complete wave v of wave 1 in blue. For now, that is not yet my expectation. But, I am open to be proven wrong in this smaller degree structure.
In summary, I am still unsure how this market will resolve this region. But, it is clearly telling us that we have again entered a difficult whipsaw environment and should be respected as such until it clearly makes its decision within this support region. As long as we remain over 4400SPX, then I can maintain the potential for the blue count, which suggests that wave [4] is done and we can make a higher high to complete wave 1 of wave [5] of [iii] back up towards the 4700 region. However, as long as we continue to respect resistance on bounces, I am going to primarily be looking lower in the green count, until the market can prove otherwise. So, yes, green will remain my primary count until the market can provide us with a higher high.
Once this market makes this decision known, then our path to 5500SPX will become much clearer for the rest of the year.