Typical 4th Wave Action
While I would love to be able to call every twist and turn during a 4th wave, it simply is just not humanly possible. We did a great job in catching just about every twist and turn for the first month or so since we started this correction, but I came into this week thinking we would set up a rally higher. And, that is clearly not what we got so far.
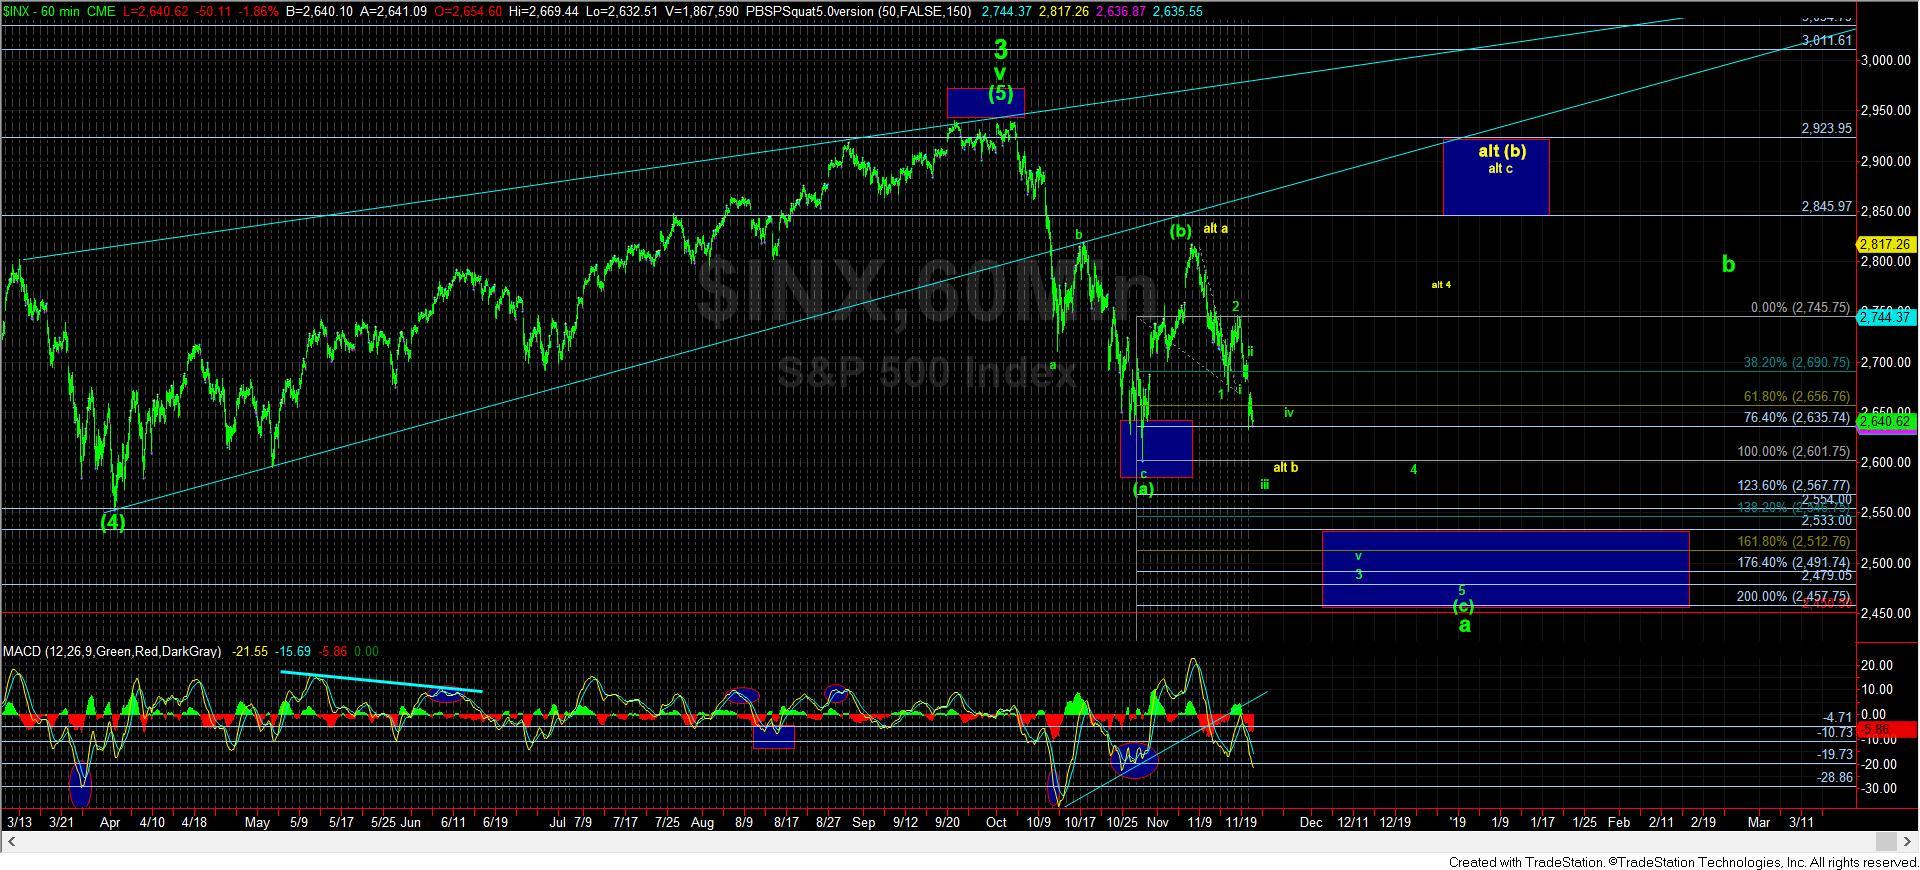
However, as I outlined over the weekend, should the market break below 2690 on the S&P 500 (SPX), that is a major warning to the long side, and begins to move the probabilities towards the yellow count (now the primary count in green), with the potential to take the market to 2500 and a bit lower to complete a larger a-wave of wave 4.
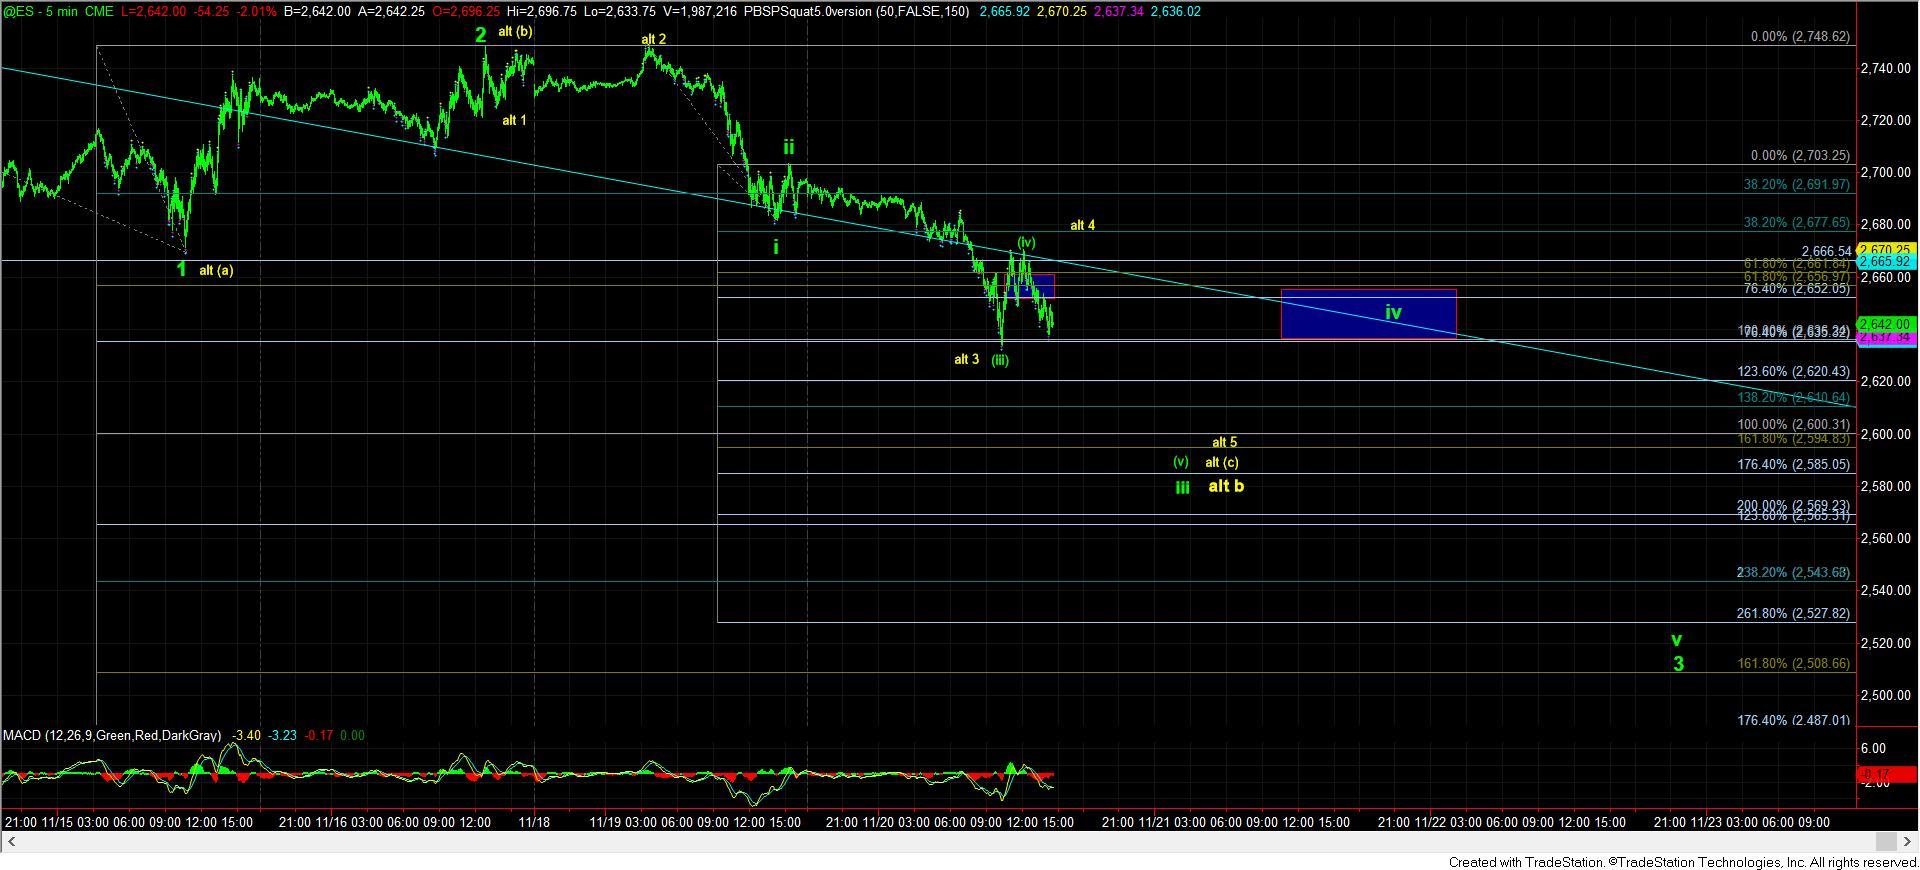
However, as the market broke down in what began as impulsive fashion, the height of what I am counting as a wave (iv) within wave iii of 3 (as seen on the 5-minute ES chart) was a bit higher than we normally see for such bounces. That suggests I should be a bit cautious of this immediate downside potential.
However, at the end of the day, as long as we remain below 2680 ES, I see us dropping down to at least the 2600 region again. And, what the market does at the 2600 region is going to tell us if we are dropping to complete the larger degree a-wave of wave 4 sooner rather than later.
I am going into a bit of detail here regarding the wave counts and the Fib Pinball progression, so please make sure you have the charts out and following along while you read this write up. Consider this a teachable moment regarding how we use confluence within the Fibonacci Pinball progression.
GREEN COUNT
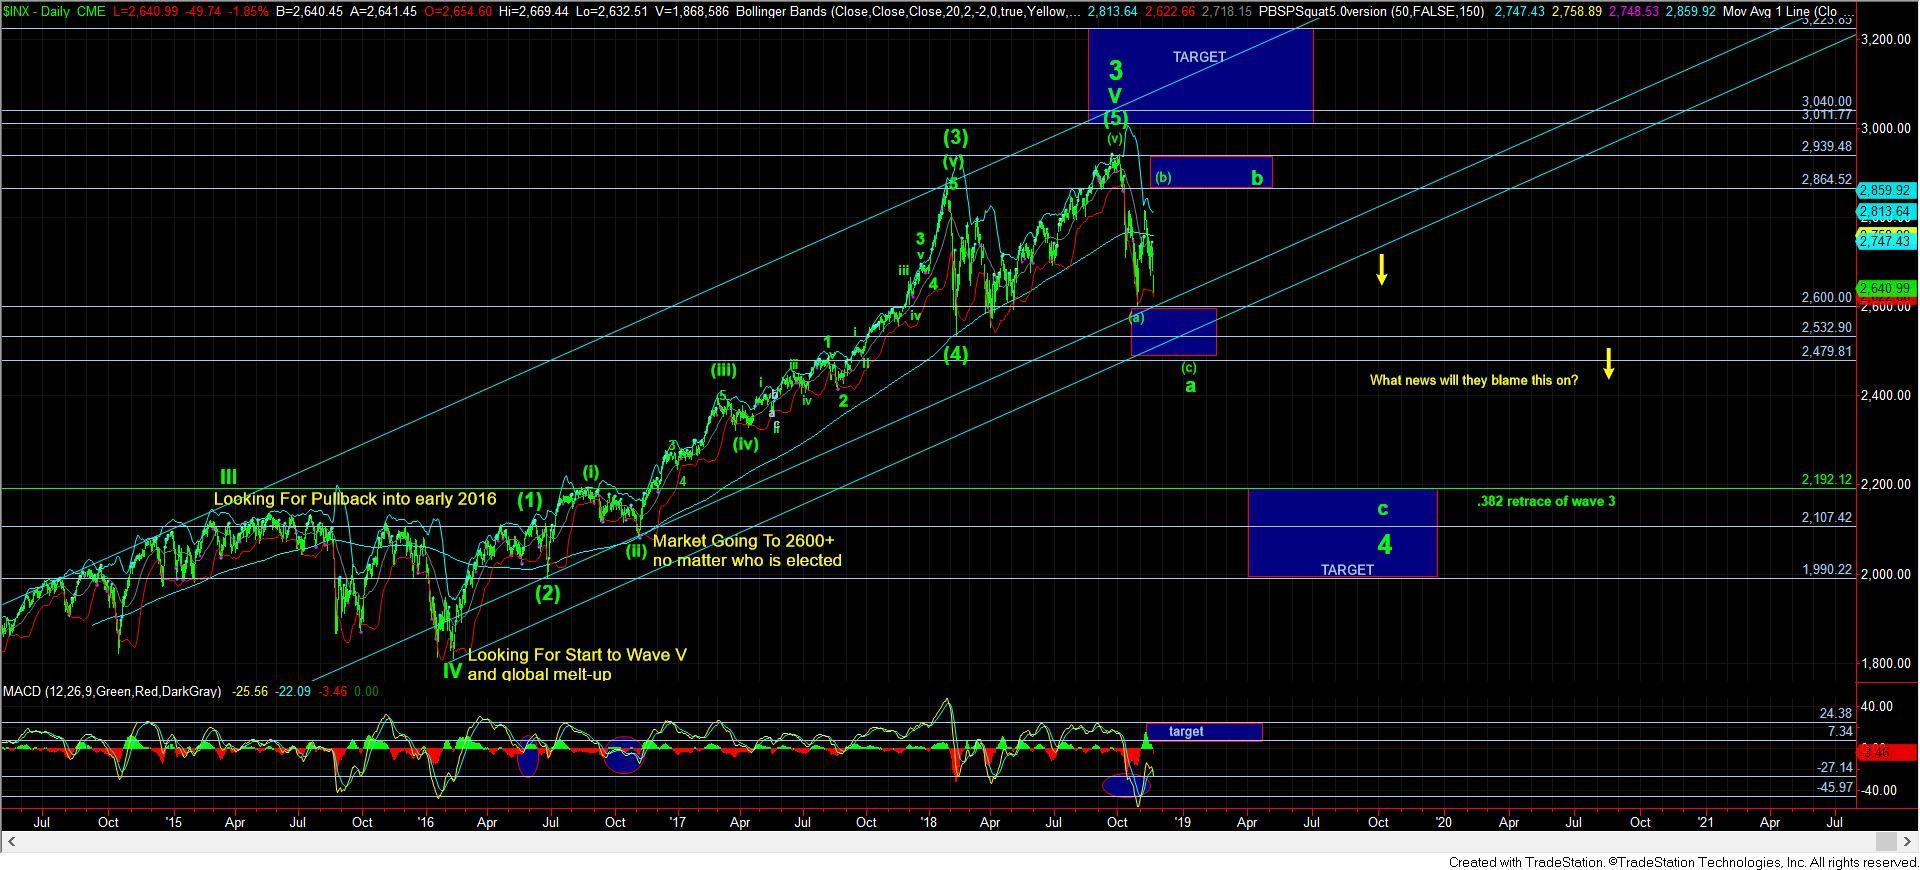
Assuming we are in the green count to 2450-90 SPX, that places us as having consolidated in wave (iv) within wave iii of 3 in the (c) wave down. That means that wave (v) of iii of 3 will target either the 1.00 extension of waves 1 and 2 at the 2600 region (which coincides with the 1.618 extension of waves i-ii of wave 3), or the 1.236 extension of waves 1 and 2 at the 2565 ES region (which coincides with the 2.00 extension of waves i and ii of wave 3).
From there, I would expect a wave iv bounce back up to the .618-.764 extensions residing in the 2635-2656 ES region, highlighted by the blue box. As long as that box holds as resistance, we will be dropping down to the low 2500 region for wave v of 3, ultimately on our way down to the 2450-90 region to complete the a-wave of wave 4.
YELLOW COUNT
Should the market move through the 2680ES region from where we current reside in a 5 wave structure, that would suggest that wave 1 of the c-wave of (b) has completed. However, the more ideal target for such a b-wave in a bigger (b) wave in yellow would be the 2600 region too. The difference between this count and the green count is that the market would rally off the 2600 region in impulsive fashion through the green wave iv resistance box.
Moreover, the pattern of such a deep b-wave within a bigger (b) wave would bring back the 2011 fractal potential for me not from a timing perspective, but from a structure perspective. You see, the b-wave within that a-b-c structure in the 2011 fractal was also a deep retrace, and should it be followed by an outsides c-wave back up over 2860 SPX, with the potential to still strike the 2900 region, it will cause me to adopt the 2011 fractal potential again. But, we are a LONG way off from this at this point in time.
Conclusion
While I would love to be able to catch each twist and turn within a 4th wave, I simply will never be able to do so, especially when one understands the nature of a 4th wave. This is why I have continually been reiterating that 4th waves should be more about capital preservation than anything else. Moreover, it is why I even noted in my weekend update that trying to play the long side is really akin to playing with fire.
Even when we got a potential set up for a long side trade, it invalidated, and that happens more often during corrective structures than at any other time within the Elliott Wave structure. This is why understanding that we are in a 4th wave is so powerful, since you know that buying the dip is no longer the certainty is used to be.
At the end of the day, I maintain the expectation that we will drop down to the 2500 region to complete the a-wave of wave 4, but the path of how we get there is what is still somewhat in question. We have a direct path with the green count, or an indirect path with the yellow count.
When it comes to levels at this time, 2680 ES is the main resistance I am focused upon that keeps us looking down to the 2600 region. And, what the market does at the 2600 region will give us our indication as to whether we are dropping to the 2450-90 SPX region sooner rather than later to complete the a-wave of wave 4.