Two Potentially Different Messages
As we know, sometimes various indices will align, and sometimes they will diverge. At this point in time, I am uncertain as to whether the IWM and SPX will align or diverge, which can mean something different for each one. Allow me to explain.
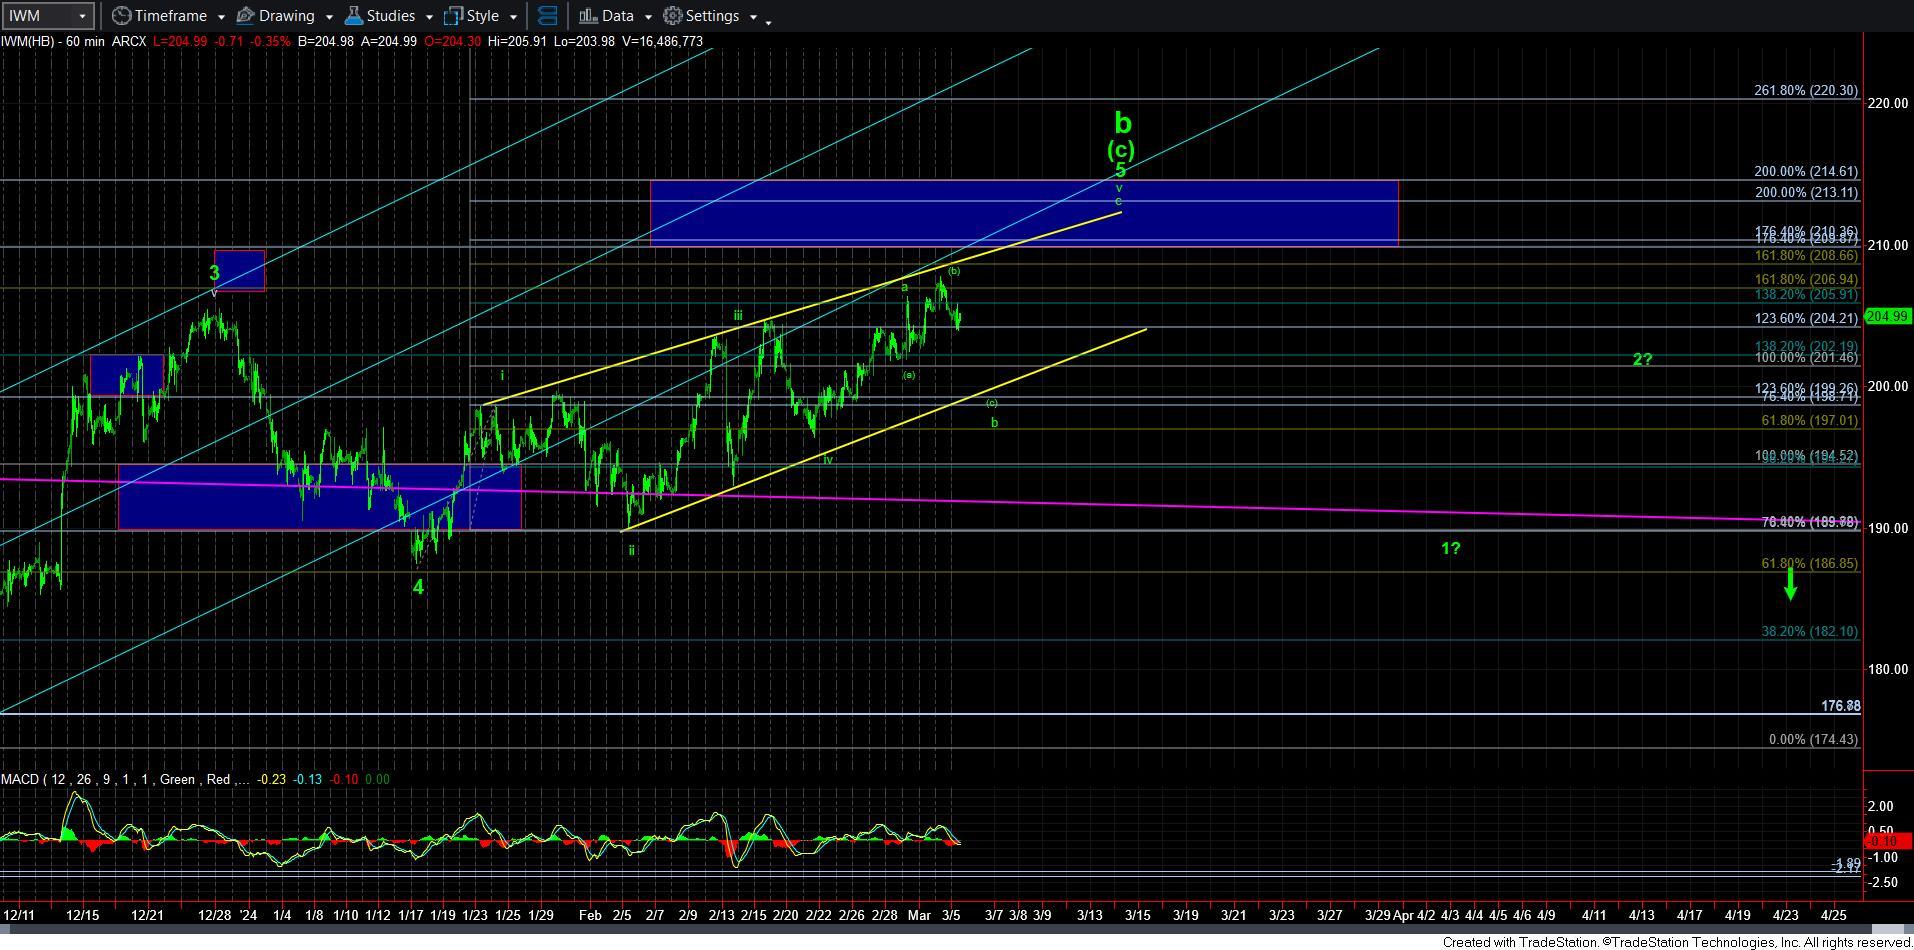
I have been using the IWM for the main signals I have been following as to when I believe the general equity market can top. And, based upon my primary count, I am viewing the current pullback as the [c] wave within the b-wave of v of the ending diagonal 5th wave. You can generally see this on the 60-minute IWM chart. That means that there is strong potential for one more higher high – the c-wave rally to complete wave v north of 209.
So, today’s decline in the IWM counts well as a 5-wave structure, which I would assume is the wave 1 of the [c] wave of the b-wave. That means that, as long as we remain below this week’s high, it is likely that the IWM can drop back down towards the 198-200 region to complete the b-wave.
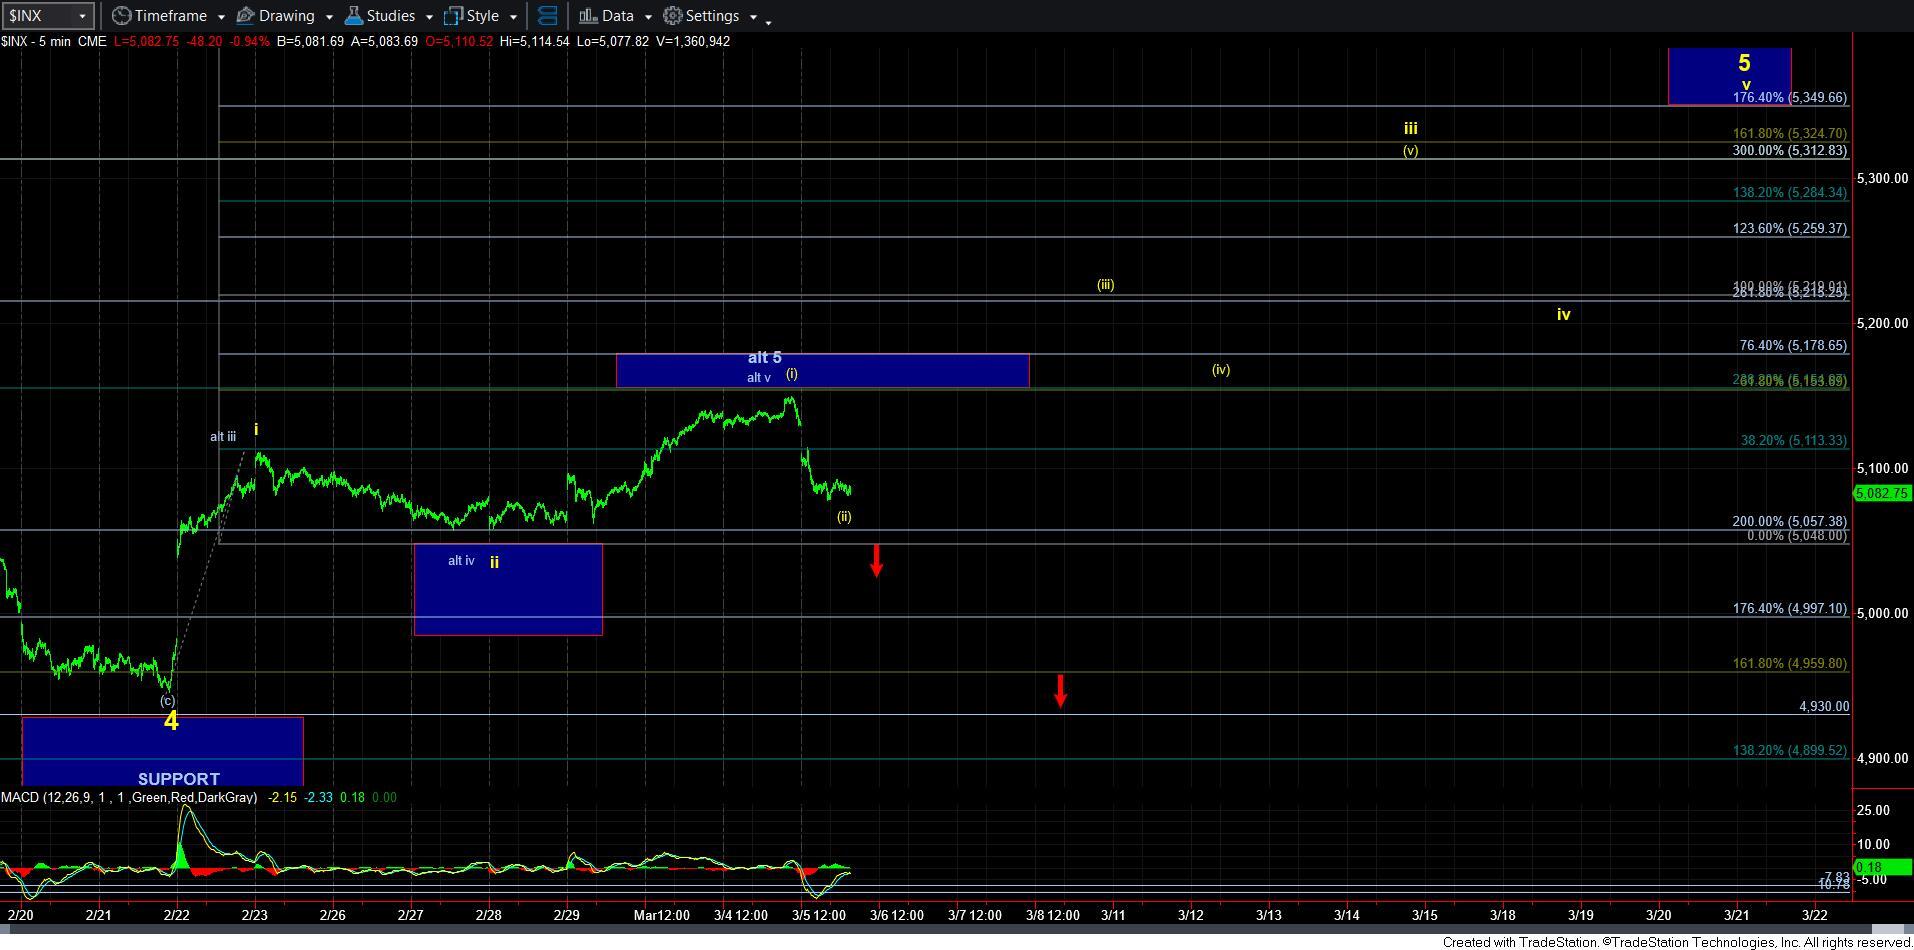
Yet, when we look at the SPX, it has reached its general target for the yellow wave [ii]. So, how will this resolve? Will the SPX just meander until the IWM drops and completes its [c] wave? Will the IWM shorten its decline? Will the SPX follow the IWM down and invalidate the potential [i][ii] on the chart? Or will the IWM complete its pattern higher and the SPX invalidate its [i][ii] and not make it through its next resistance region overhead of 5150-80SPX?
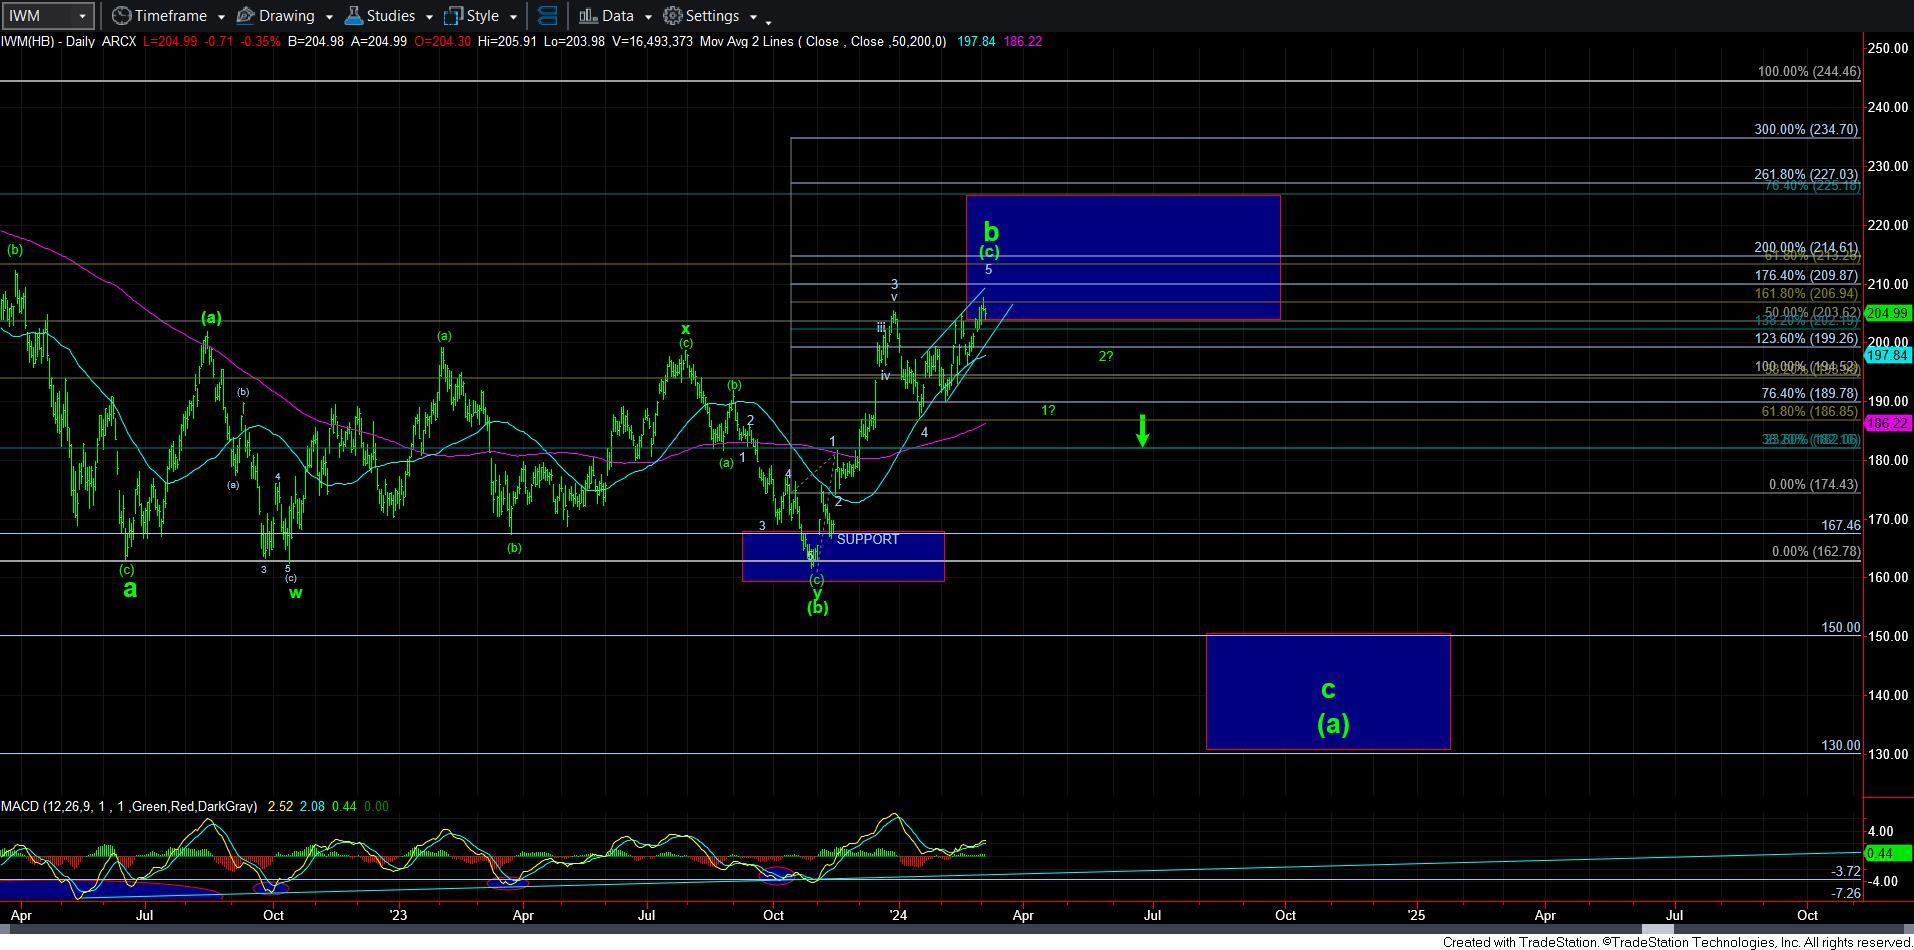
There is also potential that the IWM has completed its ending diagonal structure, but has come up short of the ideal target. You see, if we have an initial 5 waves down off this week’s high, it is entire possible that we have begun the larger degree c-wave decline to the 130-150 region. While I do not think that is the most likely outcome at the moment, it is something we have to consider if we see a strong break below 198 in the IWM.
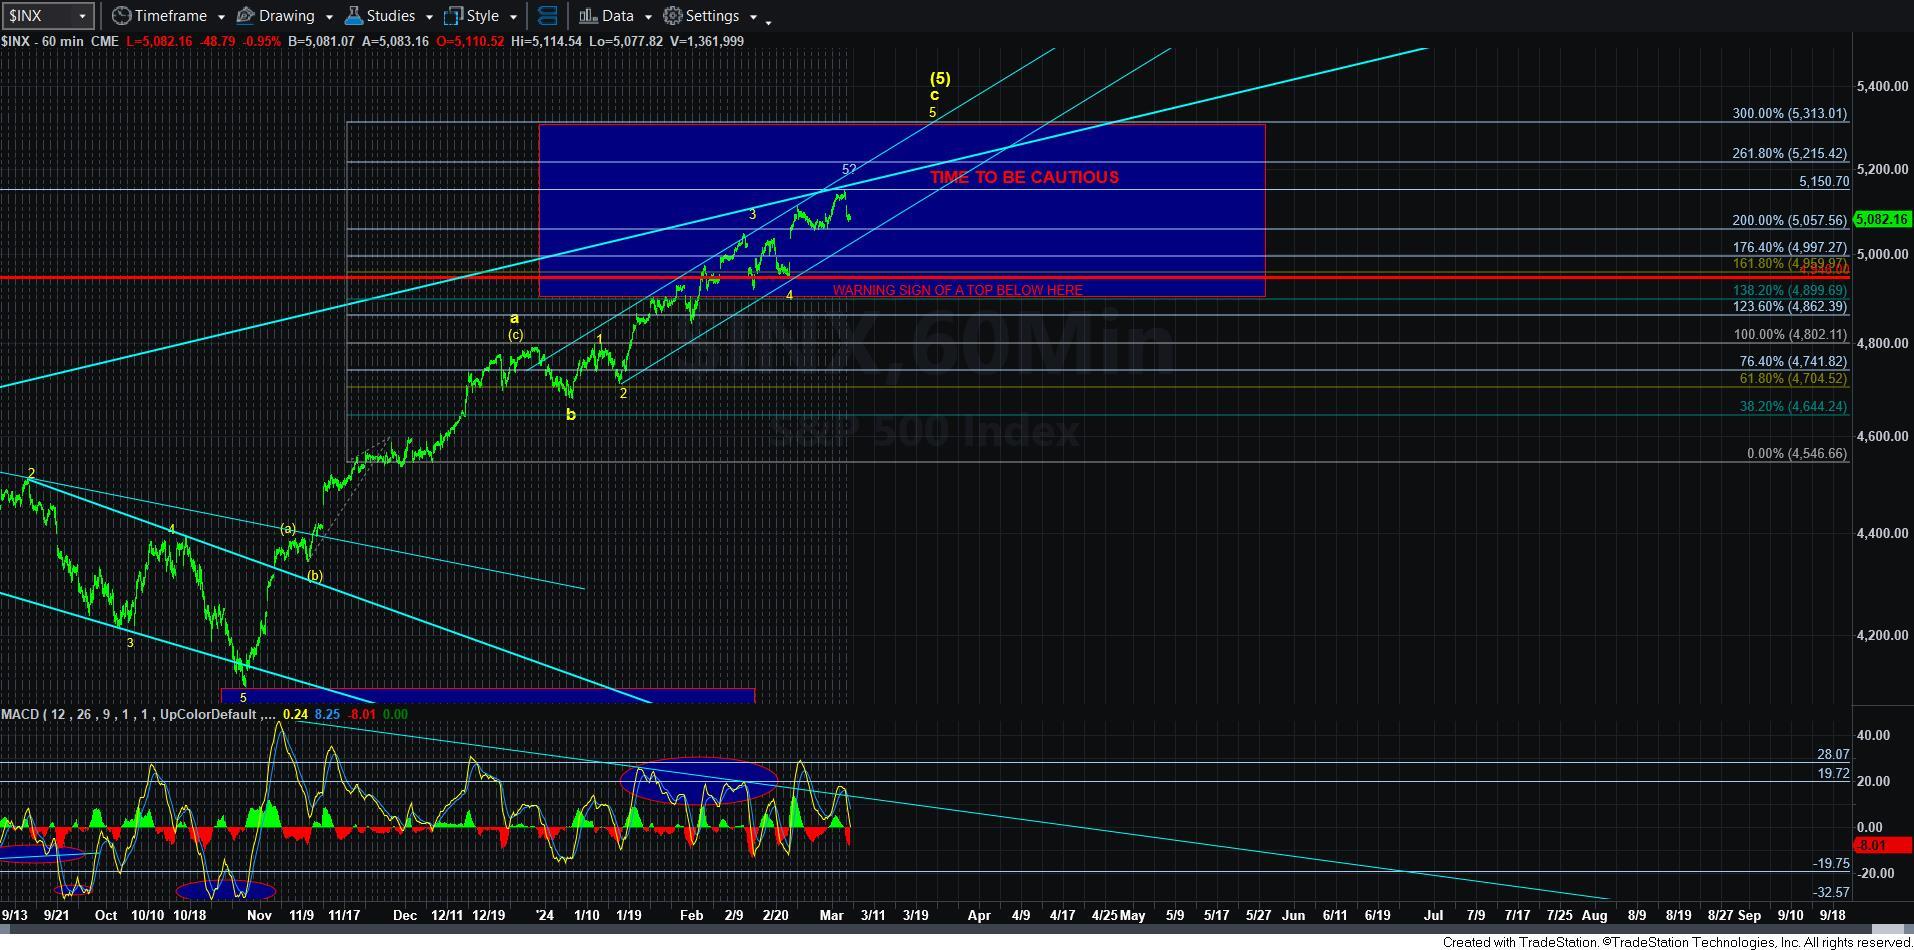
But, overall, these are questions I simply cannot answer with a high degree of probability at the moment. Remember, we now have the minimum number of waves in place in the SPX to suggest that wave 5 is done. And, if we break below 5048SPX, this would be a strong warning that we may actually be done. In other words, risks are rising in the market and you must be prepared with a risk management plan if we do top sooner than I currently expect.
For now, I am still expecting one more rally in the equity market. But, keep in mind that not all charts may follow that path. I see it as most likely in the IWM at this point in time. Therefore, it may be wise to allow another 1-2 set up to develop off the yellow wave [ii] low to make it more likely that wave [iii] is in progress before you attempt a long trade in the SPX.