Two More Likely Paths Still Point Down
Well, I was hoping the Fed would provide a catalyst to determine between the various paths we are tracking, but, no such luck.
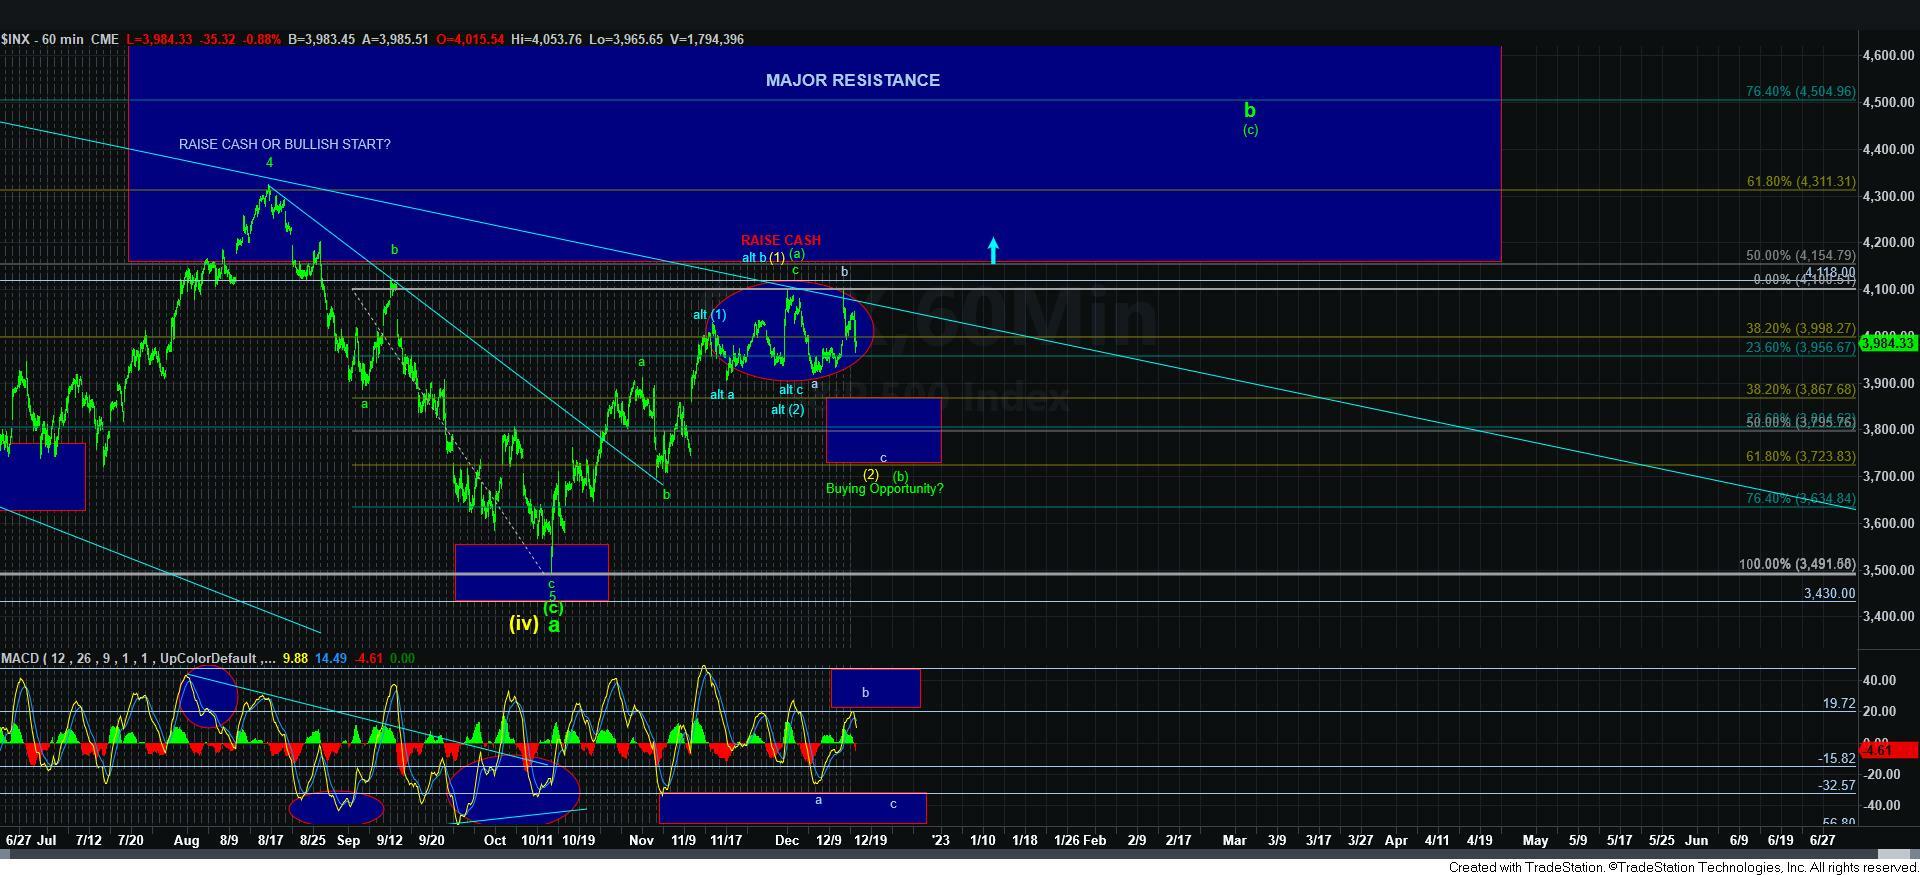
I will first discuss the blue count, as I still do not see that as the most likely path at this time. But, should we break out over this week’s high, then my hand will be forced to adopt that pattern for a rally to 4300SPX sooner rather than later.
But, the two more probable paths for me right now are presented on the ES chart and the 5-minute SPX chart.
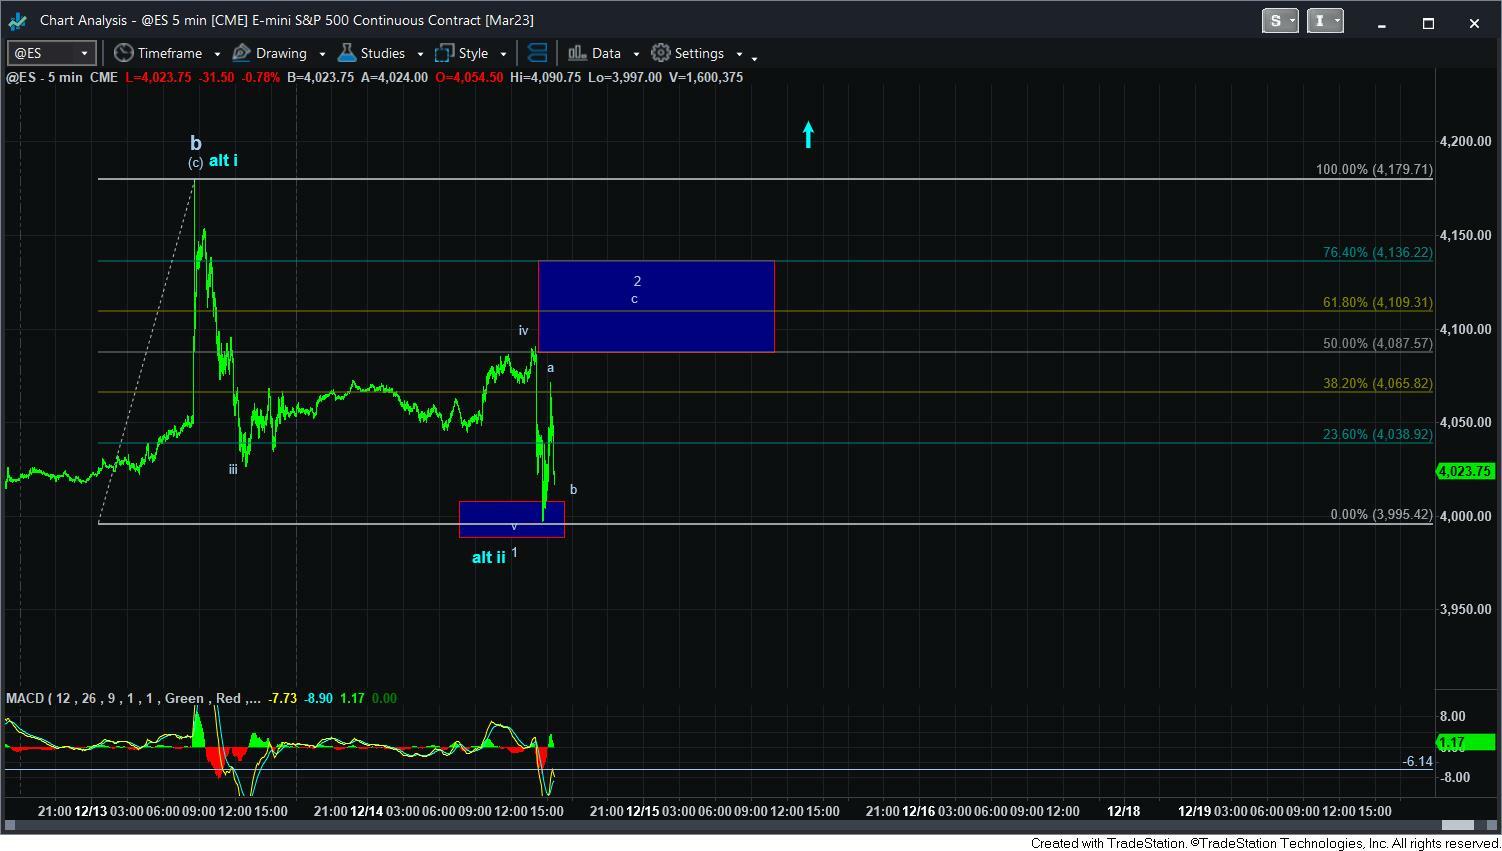
If you look at the ES chart, as the day started, I put that v/1 box where we hit our low today. Therefore, I can now count a very ugly 5 waves down off the high struck yesterday. While it clearly does not count as well in the SPX, it does provide a reasonable count in the ES. Should we see this count provide for another push higher in the c-wave of wave 2, this structure would project to the lower end of our target box below us for the c-wave of the larger degree [b]/[2]. But, in order for me to adopt this perspective, I will need to see a 5-wave decline from the wave 2 region which would point us to the .382-.618 extension of the 1-2 structure (from wherever the wave 2 tops).
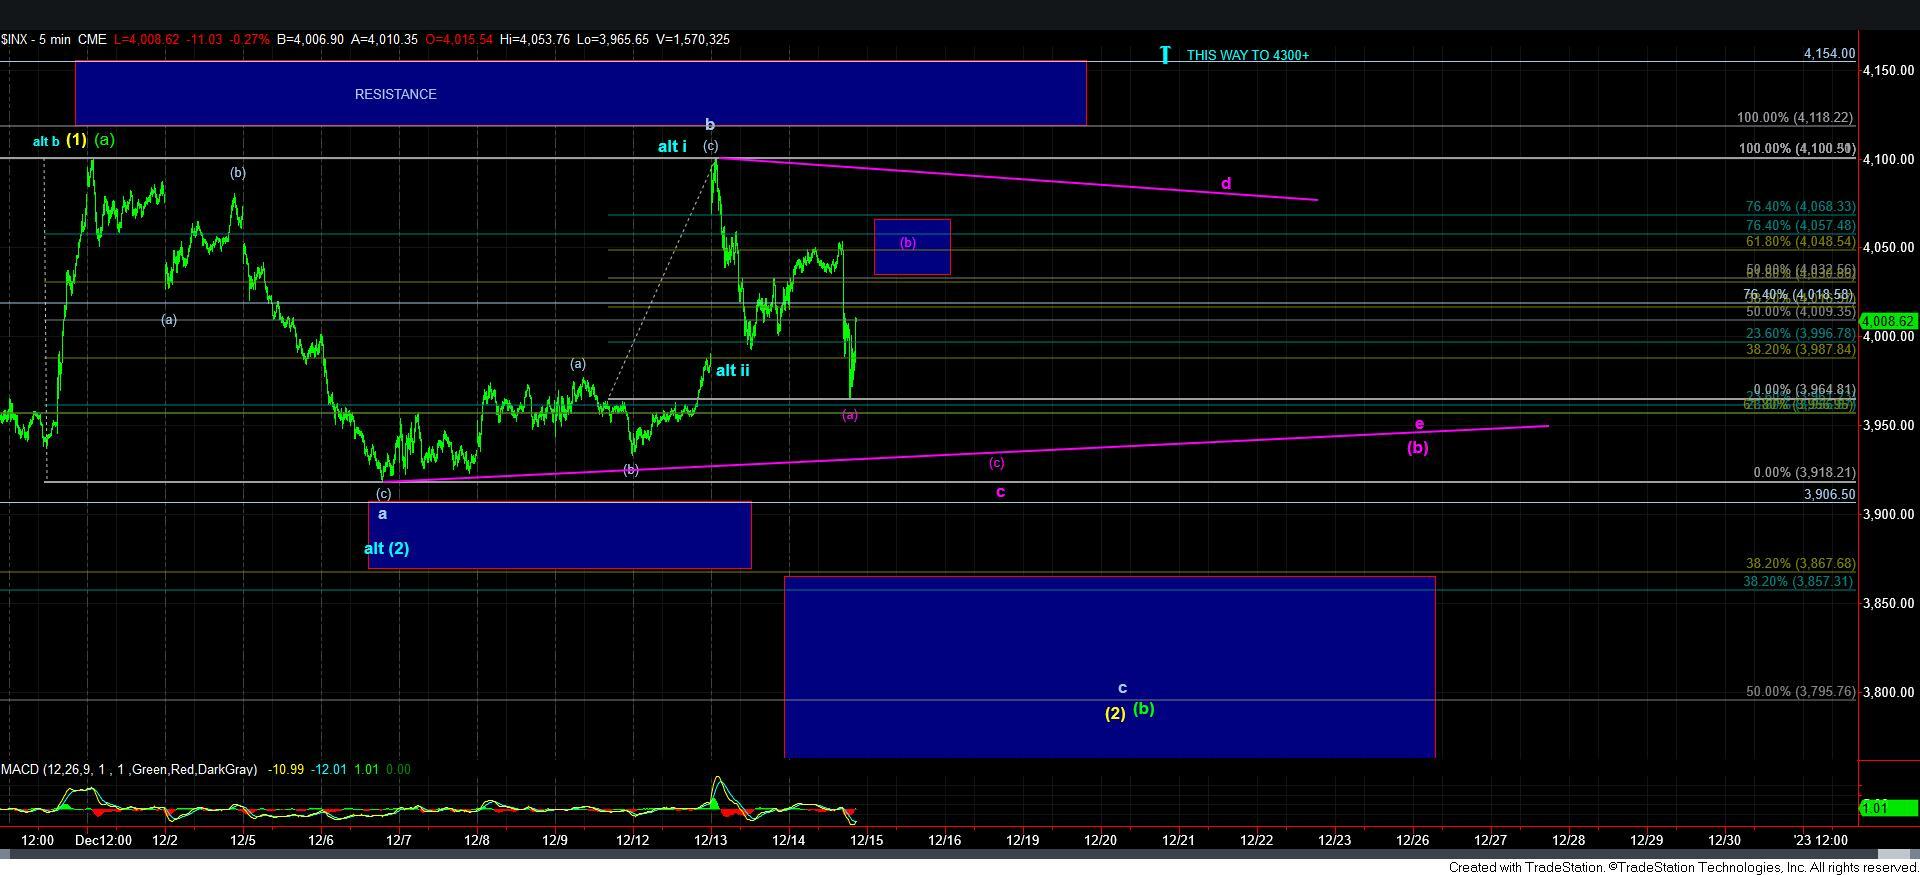
The other potential is presented on the 5-minute SPX chart, and that is the [b] wave triangle count. As I noted yesterday and repeated today, there is always at least one complex structure within a triangle and it most commonly is seen in the c or d waves, and sometimes in both. So, that is what I am showing on the 5-minute SPX chart.
The other potential that I have mentioned before is a corrective looking decline structure which breaks down below 3920SPX, which would signal that an ending diagonal is taking shape for the c-wave drop, and that would likely suggest we can hold the top half of the support box below for the larger [b]/[2].
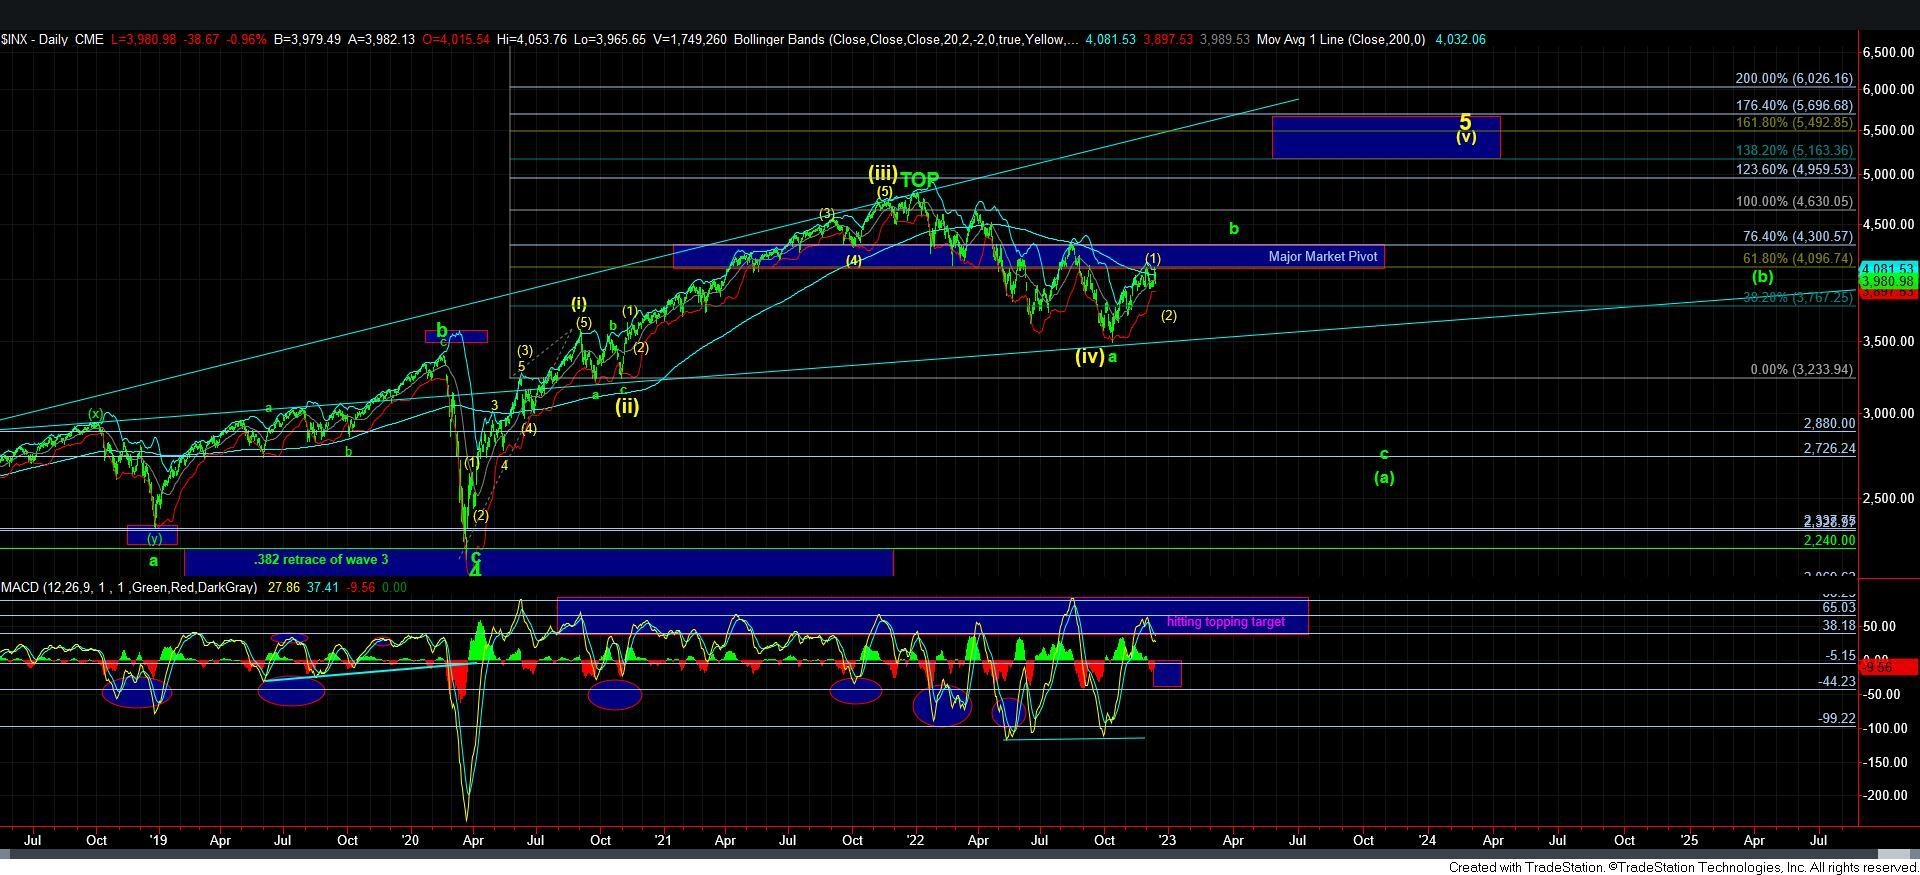
Lastly, both the 60-minute and daily MACD's also suggest they have lower to ideally reset for the rally I want to see to 4300SPX.
In summary, as long as the market respects the resistance boxes I have outlined on the two 5-minute charts, I am expecting further downside. And, the structure of the downside, as well as whether we hold 3920SPX or not will likely determine how this consolidation completes and then begin the rally I think we can still see to 4300SPX.