Two Main Paths - Market Analysis for Apr 7th, 2016
With the break of the last upside set up to extend wave iii, we are assuming the market has topped in wave iii, and is now in wave iv, and within the a-wave of that wave iv. As we know, markets can take many twists and turns within a 4th wave, so I am going to present two possibilities.
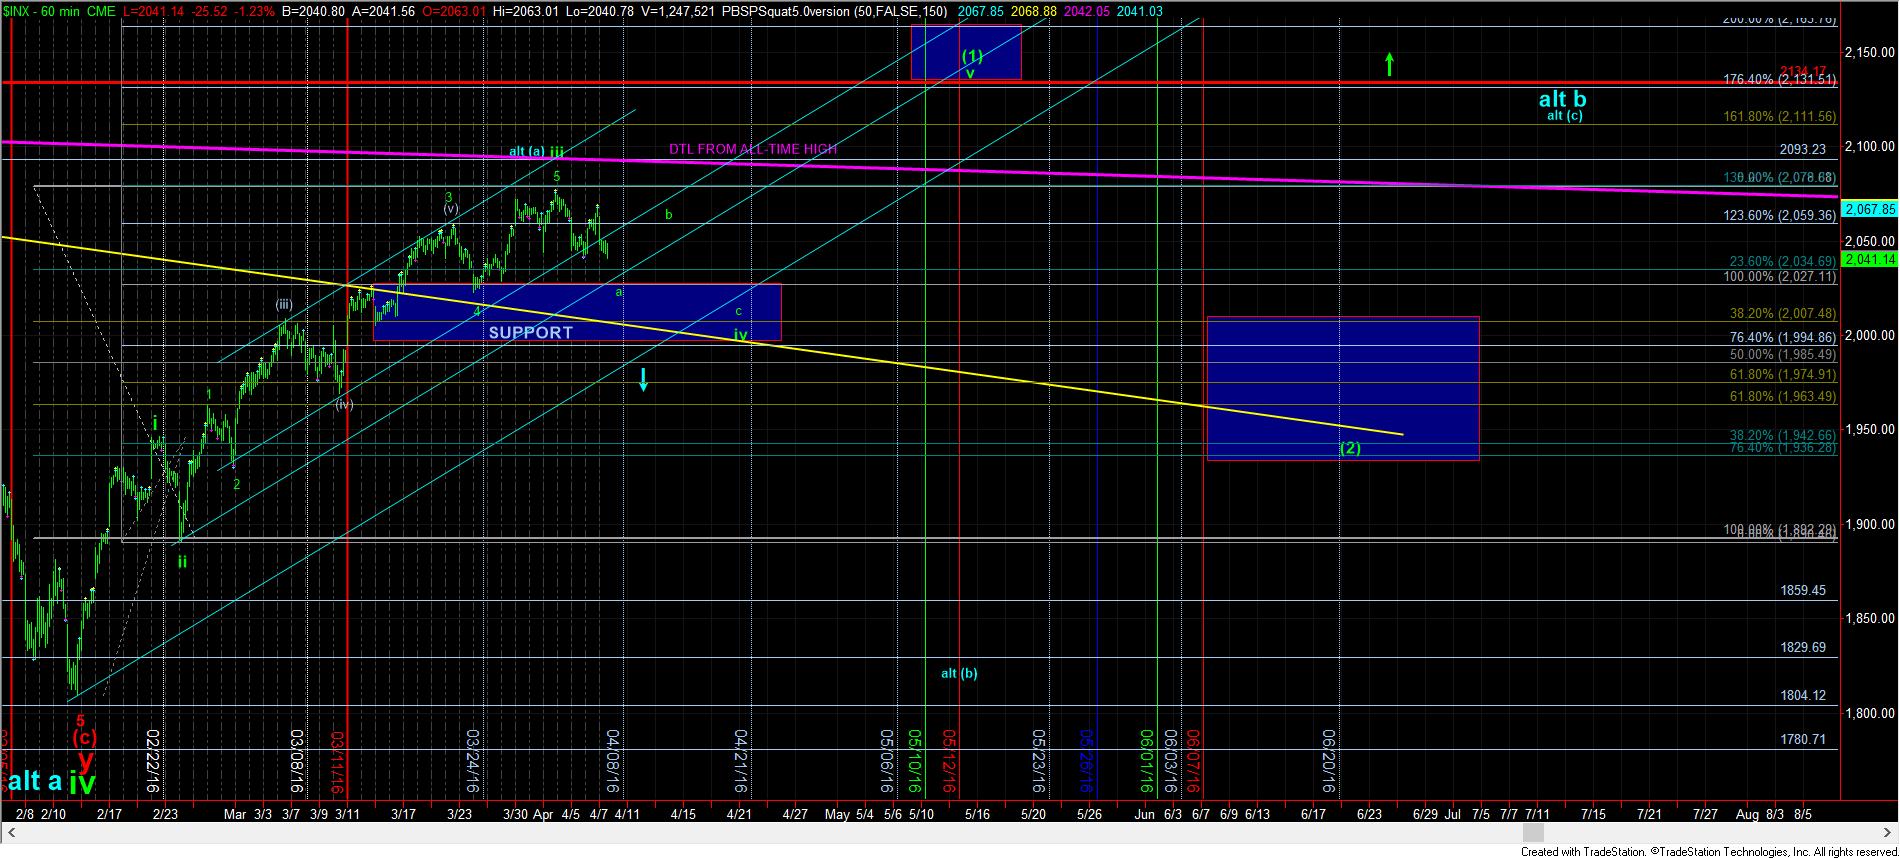
The first is the one I have had on the chart this week. This one suggests the a-wave will target the 2027-2034SPX support region, and then bounce back in a b-wave back towards 2060SPX. The 2034SPX level is the .236 retracement of wave iii, which is often the target for an a-wave in wave iv. As you can see, it would also set up a bigger heads and shoulders pattern in this set up. And, it points to the .382 retracement target we have for this wave iv in the 2008SPX region, which I have noted has excellent confluence with the prior all time highs.
The second pattern is that we are in the c-wave of wave iv right now, and a break down below 2027SPX points us directly to the lower targets.
Lastly, as we have discussed, the alternative count is that this entire rally off the February low is a corrective rally, and a break of 1994SPX and the uptrend channel on the 60 minute chart would suggest that we are heading down to the 1700’s in the SPX, but it may not be a direct path. Should the alternative pattern confirm, it will make the rest of 2016 quite bearish, but quite difficult as well.