Turned Down At Resistance Yet Again
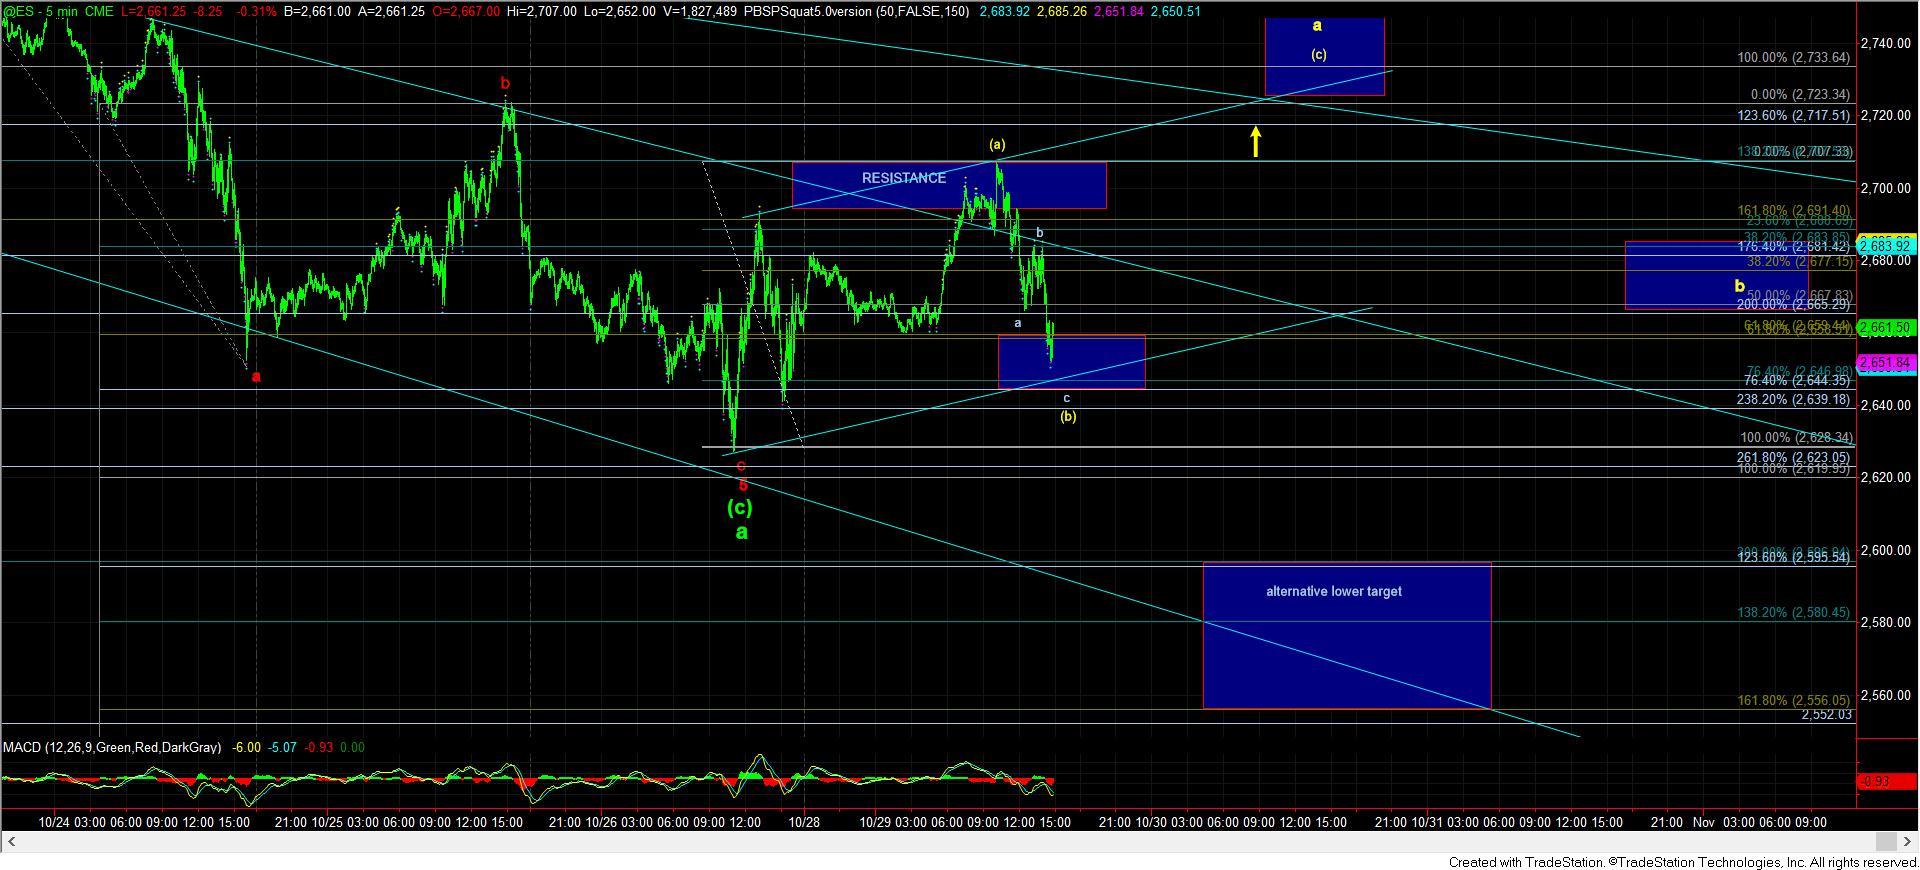
When the market bottomed on Friday at the support we presented, it initially turned up strongly and gave us a possible indication that a bottom may be in for the green a-wave low within this wave 4. And, Sunday night, I laid out a set up which would have potential to take us up to resistance, and potentially even beyond on the 5-minute ES chart. Taking us beyond resistance would have provided initial confirmation that the green a-wave has completed.
Overnight, the market followed through as we drew it up, and this morning, we test the top of the resistance box I put on the chart on Friday. However, I noted that if the market were to break back down below 2684ES, it would open the door to the potential that the green a-wave may not yet be complete, and that we can test the 2587-2600SPX region still.
When we broke back below 2684ES, I identified a lower support in the 2645ES region. And, as long as the market is able to hold that support, it can still allow us to “prove” that the green a-wave may have found a bottom. However, if that region of support were to break, then it would make it highly likely that the green a-wave has further work to the downside, with the next target region being in the 2587-2600 region.
So, yes, this market continues to be complex and treacherous. The main reason it is this complex is that this (c) wave down in the green a-wave would normally be a standard 5 wave event. However, in our case, it turned into an ending diagonal. And, due to it being an ending diagonal, there is much overlap which really does not give us a good indication as to where it will bottom, especially since we came up short of the 2587SPX ideal (a)=(c) target region.
For this reason I have been quite clear that the only way to see a more confident long set up would be to allow the market to prove the green a-wave has completed by completing the yellow a-wave off the lows, which should have a minimal target in the 2720-30 region. And, as I outlined in my detailed write up today, from there I would expect a b-wave retrace presented in yellow, which could provide an initial entry for a long attempt. You can always add to that position should we see a confirming 5 wave structure develop off that support, to provide greater assurance that we are heading up to the 2800+ region in a c-wave rally.
For now, the market remains quite treacherous. And while it is still leaving us quite a few bread crumbs along the way to tell us where it is turning, as we have caught most of these turns in this whipsaw action, it has not told us yet that this green a-wave has completed. And, until that happens, we still have a lower ideal target sitting out there for the green a-wave within the 2600SPX region.
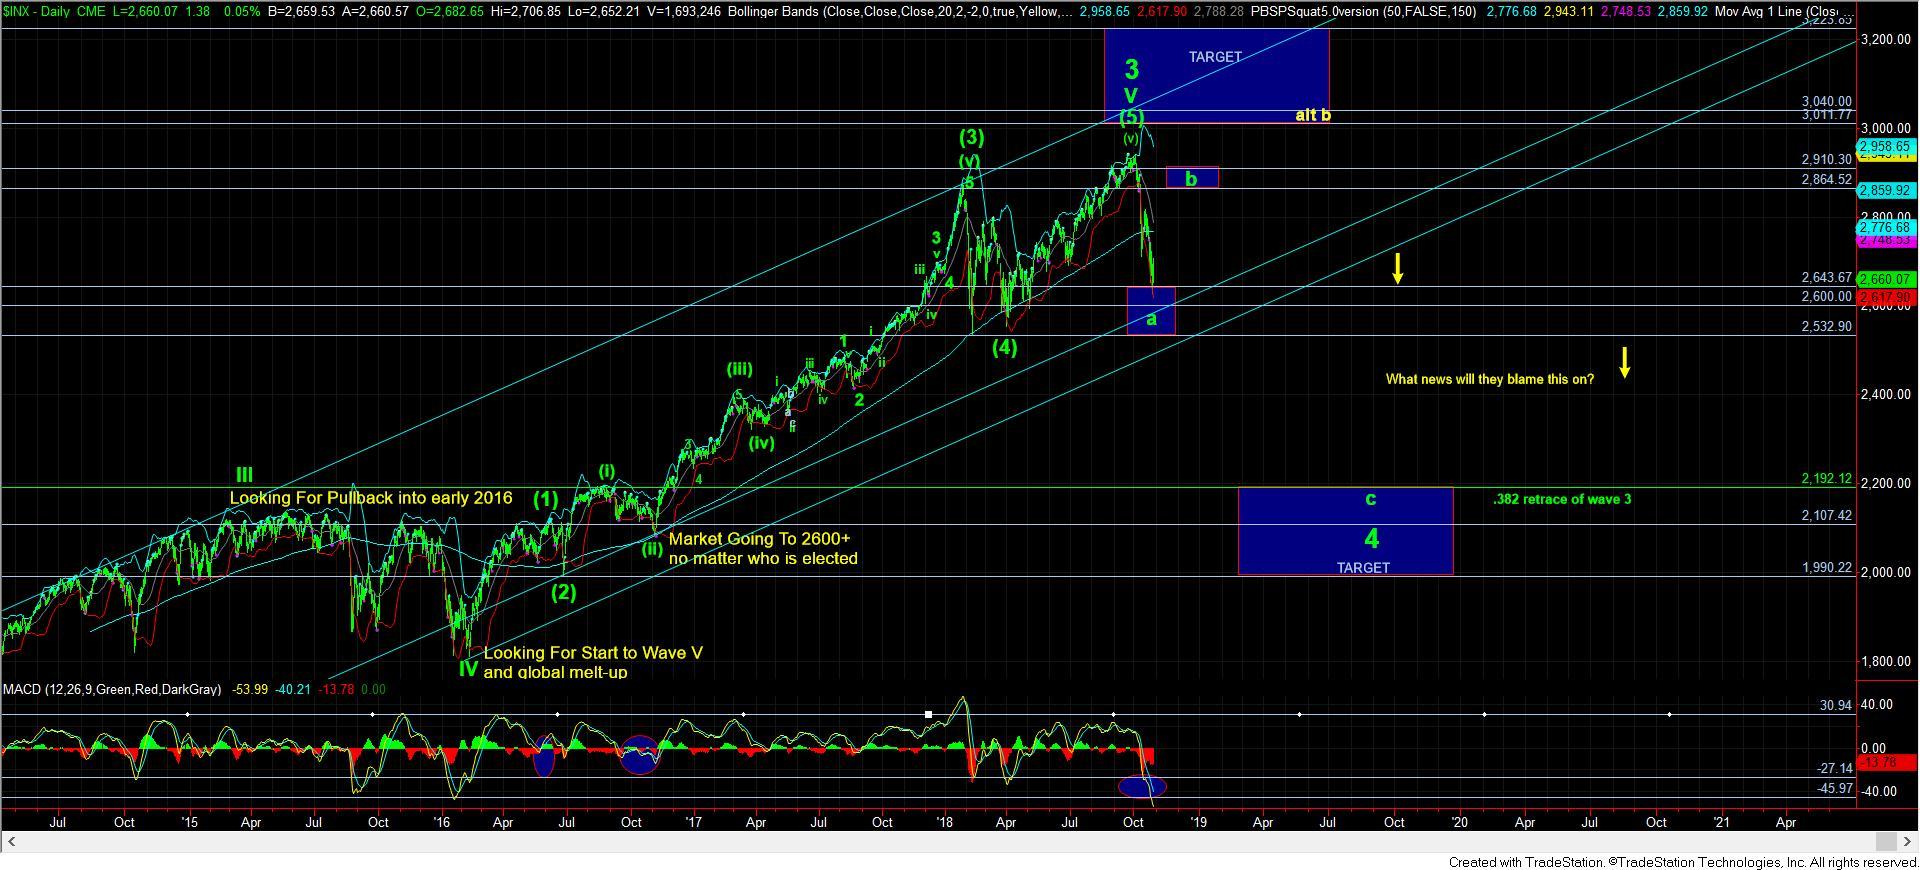
So, at this point in time, I still cannot make any determinations as to how high the b-wave rally we want to see on the daily chart will take us. We still do not have confirmation that the a-wave has completed just yet.