Trying To Simplify - Market Analysis for Sep 5th, 2024
If you have been following closely, you would know that we have been expecting this pullback in the market. While I initially thought we would push higher one more time before it began, we are clearly within the pullback which has been on our charts, with the expectation that it would begin once the last rally concluded.
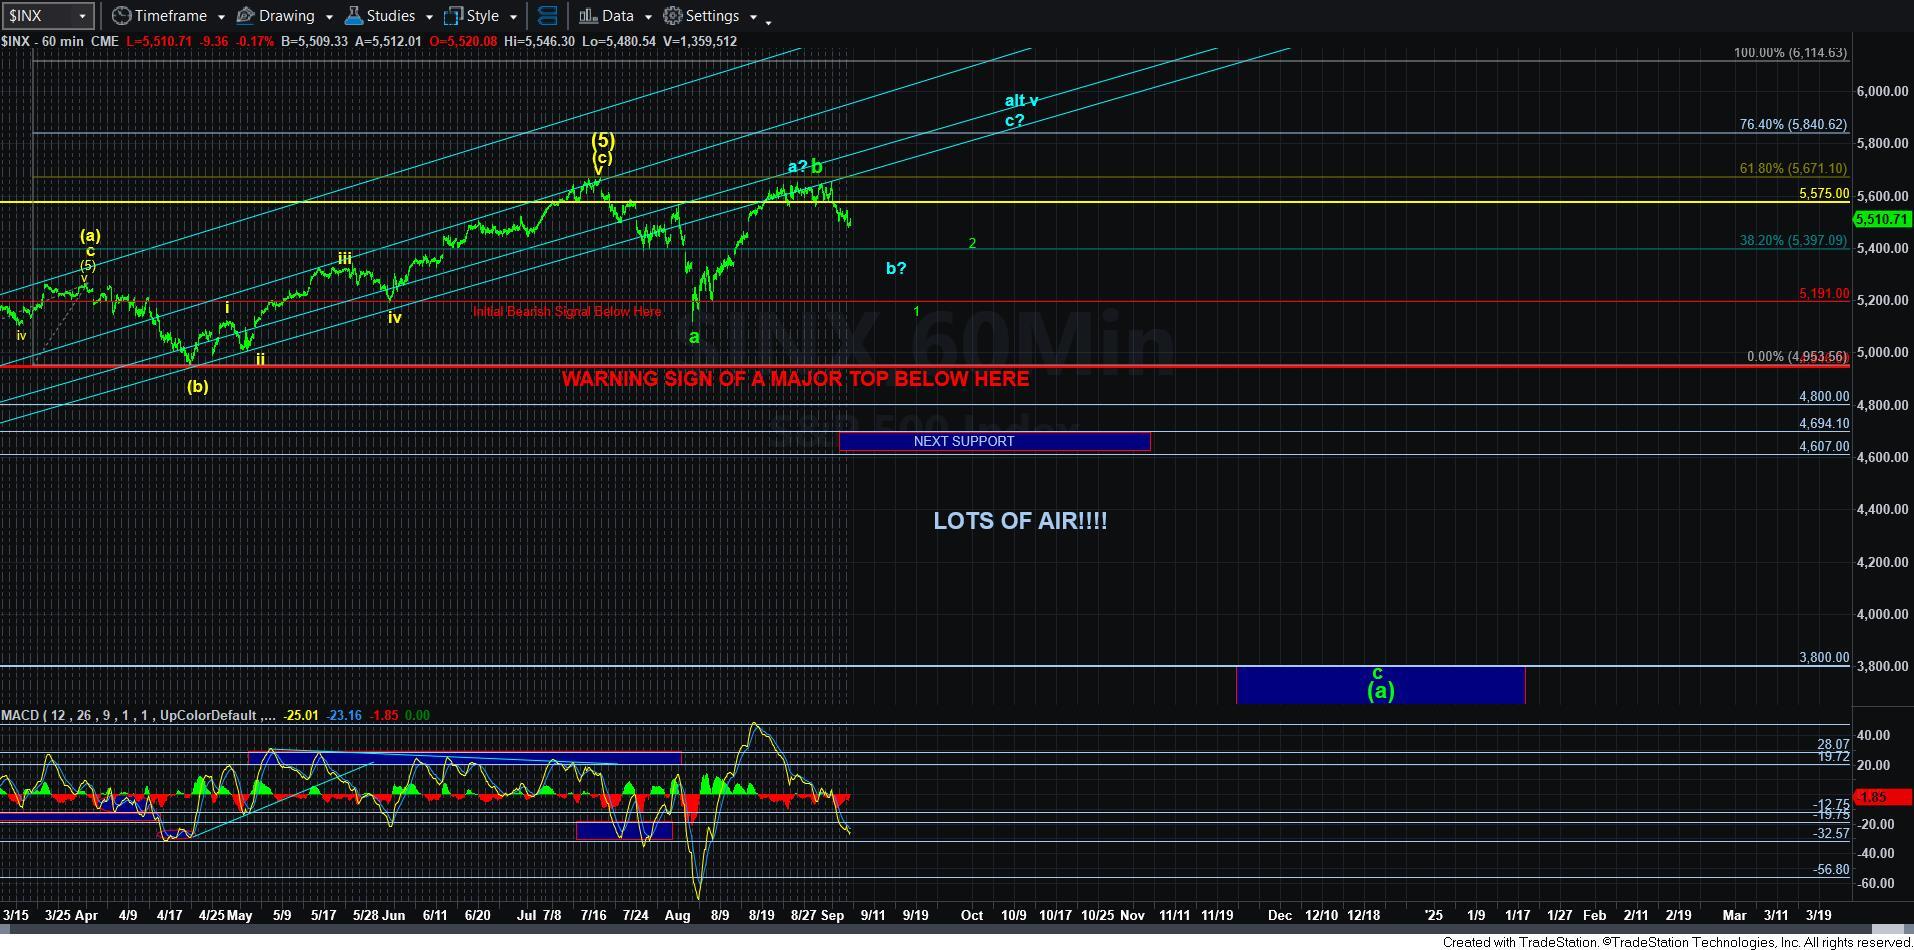
Now, it is within this pullback that the market will likely provide us with a structure which will clarify whether the market is going to attempt to rally next to the 5840SPX region (the blue wave count), or if we have struck our long-term top already, and we have begun wave 1 of a larger degree c-wave, which points us ideally down to the 3800SPX region.
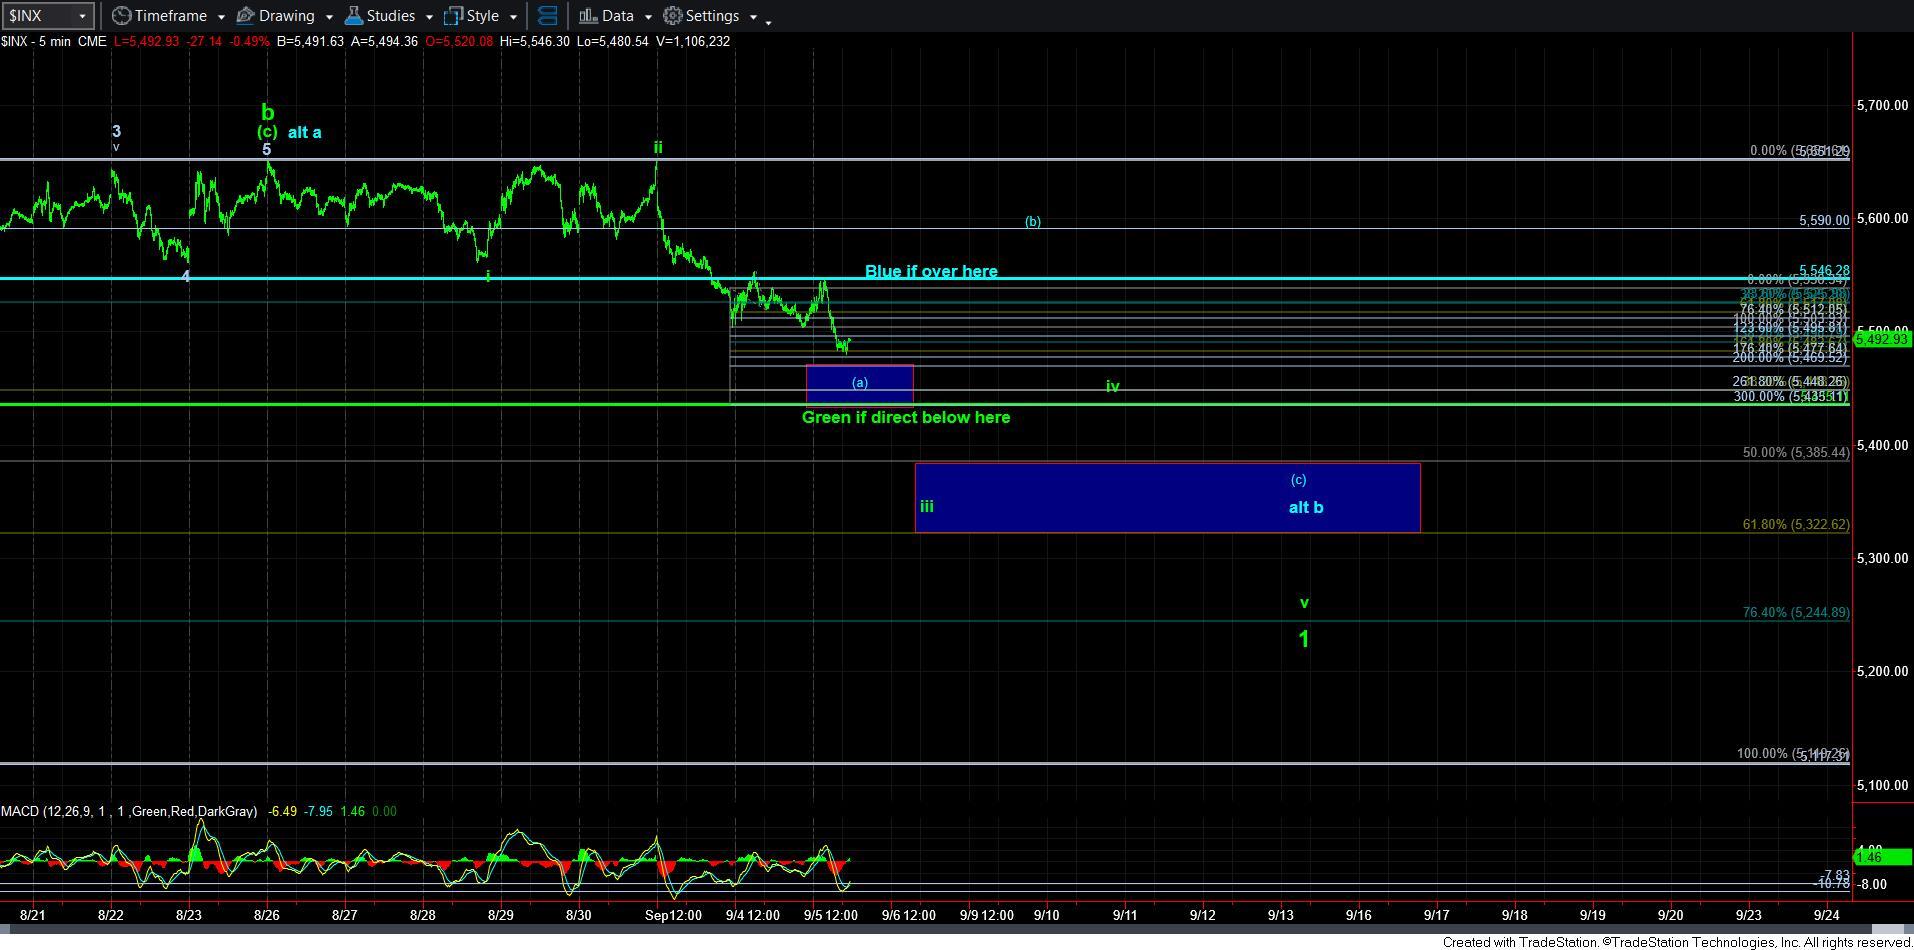
To make this analysis easier, please take a gander at the 5-minute SPX chart. In very simple terms, should the market exceed the 5546SPX level before it breaks down below 5435SPX, then the probabilities begin to shift towards the blue count pointing us north. But, even so, please recognize that I still think we get one more decline in a [c] wave down to the larger degree support box before that rally begins in earnest. Of course, if the rally off what I am counting as the [a] wave support box takes shape as clearly impulsive, then I will adjust and view us as having begun that rally already. But, for now, I am still expecting a more sizeable [a][b][c] structure within the blue b-wave.
However, if the market begins to break down below the 5435SPX region before it breaks out over 5546SPX, then the probabilities shift towards the green count, meaning the larger degree top has been struck. Such a break down would suggest we are in an extended wave iii of wave 1, as shown on the chart. Of course, I will still need to see waves iv and v take shape before I don my bear suit.
So, the market has given us some nice parameters with which we can work over the coming days to determine if the market intends on pushing higher yet again, or if a major top has indeed been struck.


