Trying To Make Sense Of This Mess
Due to the break of the pivot yesterday, the market has left us in a very complicated posture. I am going to try to explain the potentials so that you can understand the difficulties.
When we broke the pivot yesterday, it told us that we will not likely get a standard Fibonacci Pinball 5-wave structure off the recent low. That does not mean we will not be going to higher highs from here. But, it does mean we have to be MUCH more cautious of the near term bearish potential in the coming weeks and months.
When we broke down below the pivot, the market told us that it is taking shape in 3-wave structures. These structures are often corrective structures, which is why we will have to be so cautious about the potential of the yellow count later this year.
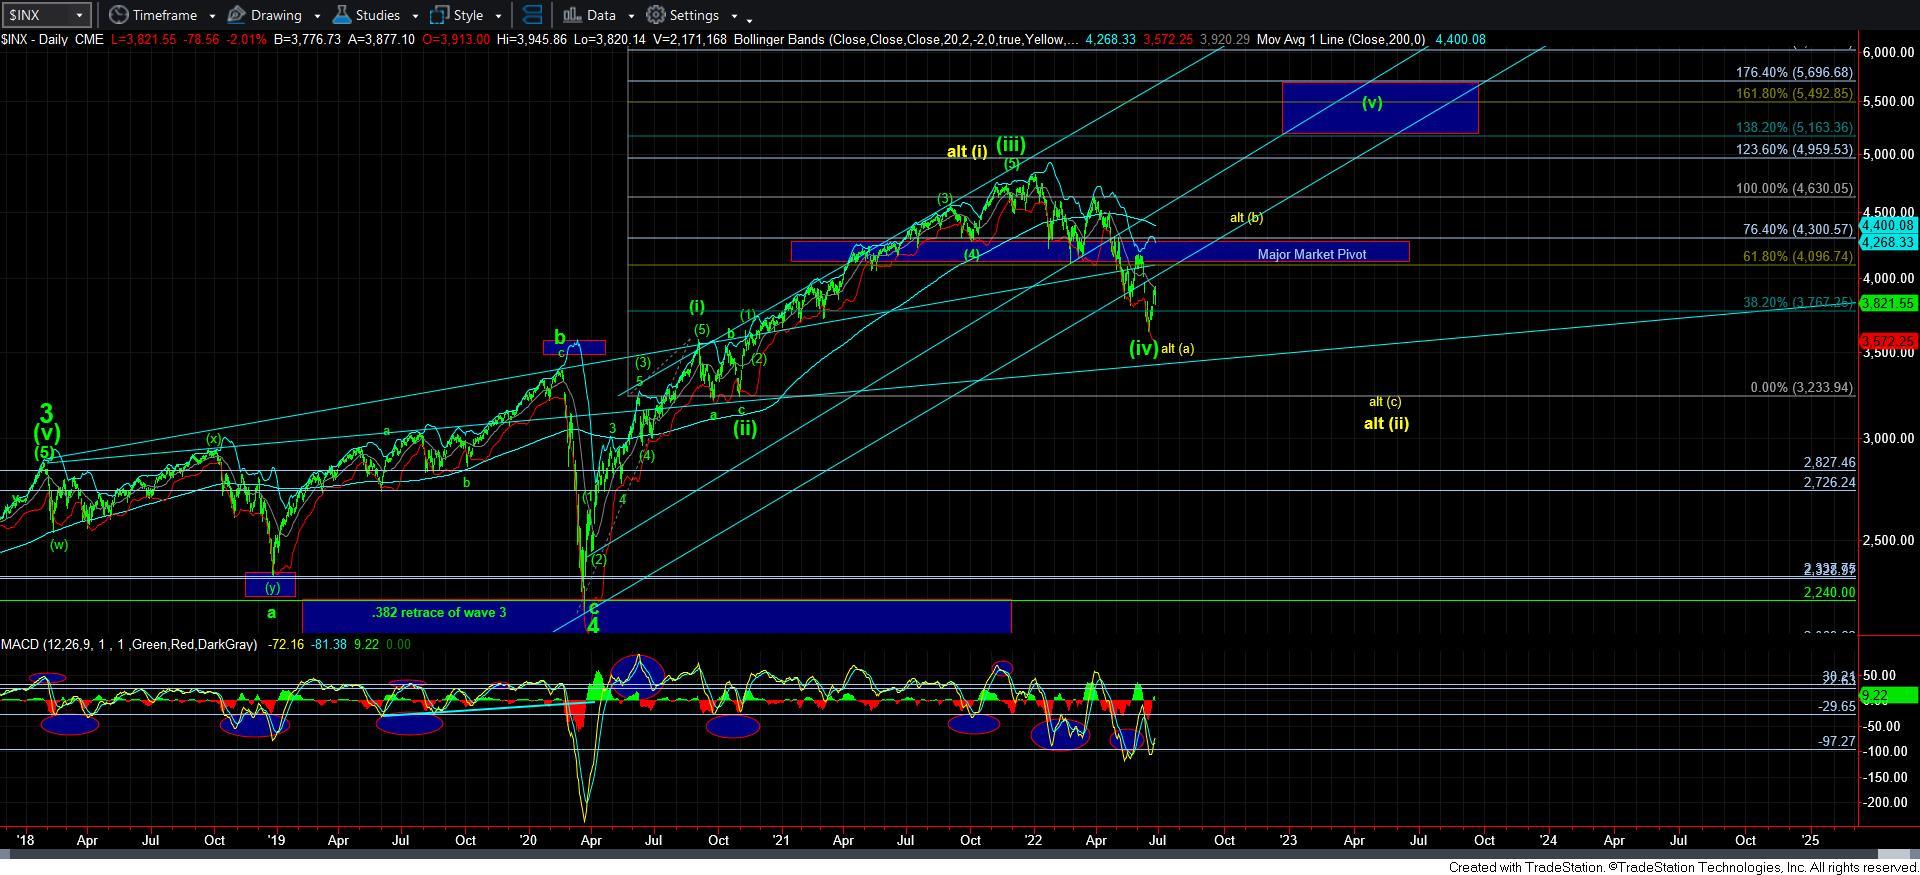
But, before I go into the wave counts, I want to again take note of the daily chart. We have significant divergences presented on that chart, which normally suggests that we see a multi-week, if not even a multi-month rally. For this reason, I do not have any counts on the chart pointing to further immediate lower lows. So, I hope that clarifies why I am not looking IMMEDIATELY to lower lows.
Now that the market is telling us we are LIKELY going to be moving higher within a-b-c structures, I want to outline what I am now looking for over the coming weeks.
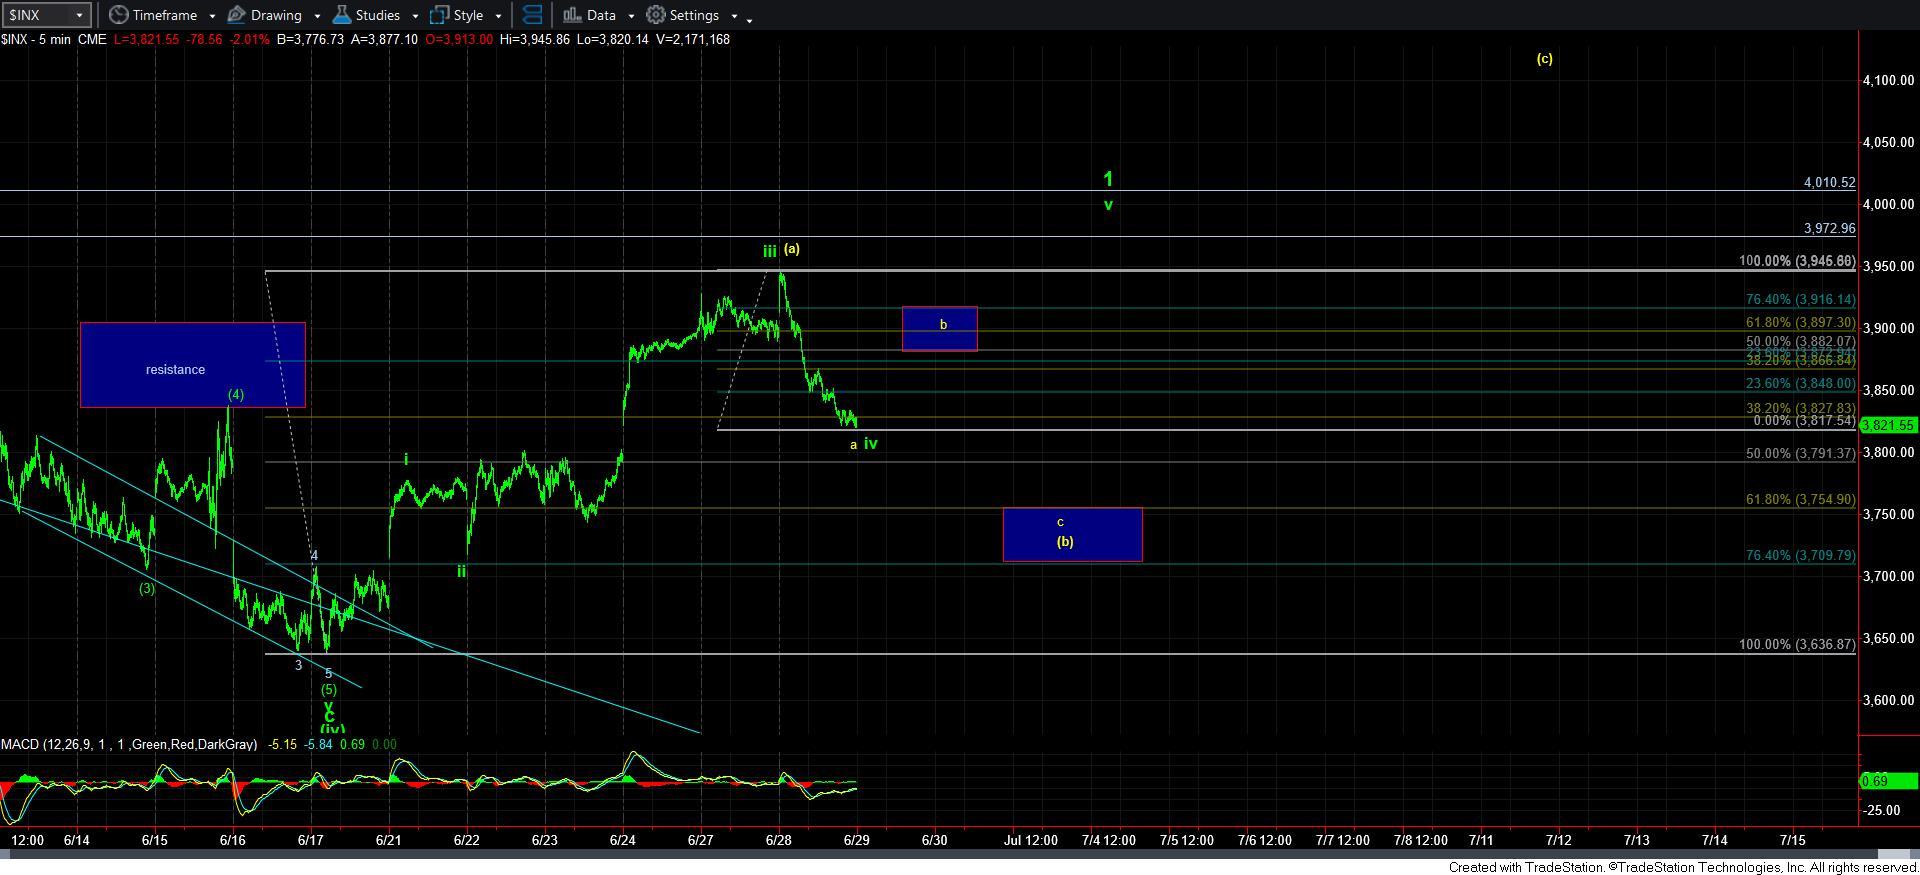
As you can see from the 5-minute chart, I am still leaving a bullish count potential for a leading diagonal outlined in green. I do not rely upon leading diagonals as trading cues until the market proves it. That means we need to move DIRECTLY to the 3970-4010SPX region over the coming week or so, and then pullback in a corrective wave 2. Should we then rally back over the high of wave 1, I will then adopt the leading diagonal as a much higher probability count. But, I want to note that I remain VERY skeptical of this potential as it does not project high enough in a 5-wave structure in a standard ending diagonal to take us to new highs.
Therefore, as long as the market is unable to move through the box between 3880-3915SPX, I view that resistance as having strong potential to turn us back down towards the 3750SPX region in the c-wave of the yellow [b] wave. And, as long as we hold that blue box support for the yellow [b] wave, I will be looking for an impulsive [c] wave rally pointing us up to the 4100+ region to complete a larger a-wave in yellow.
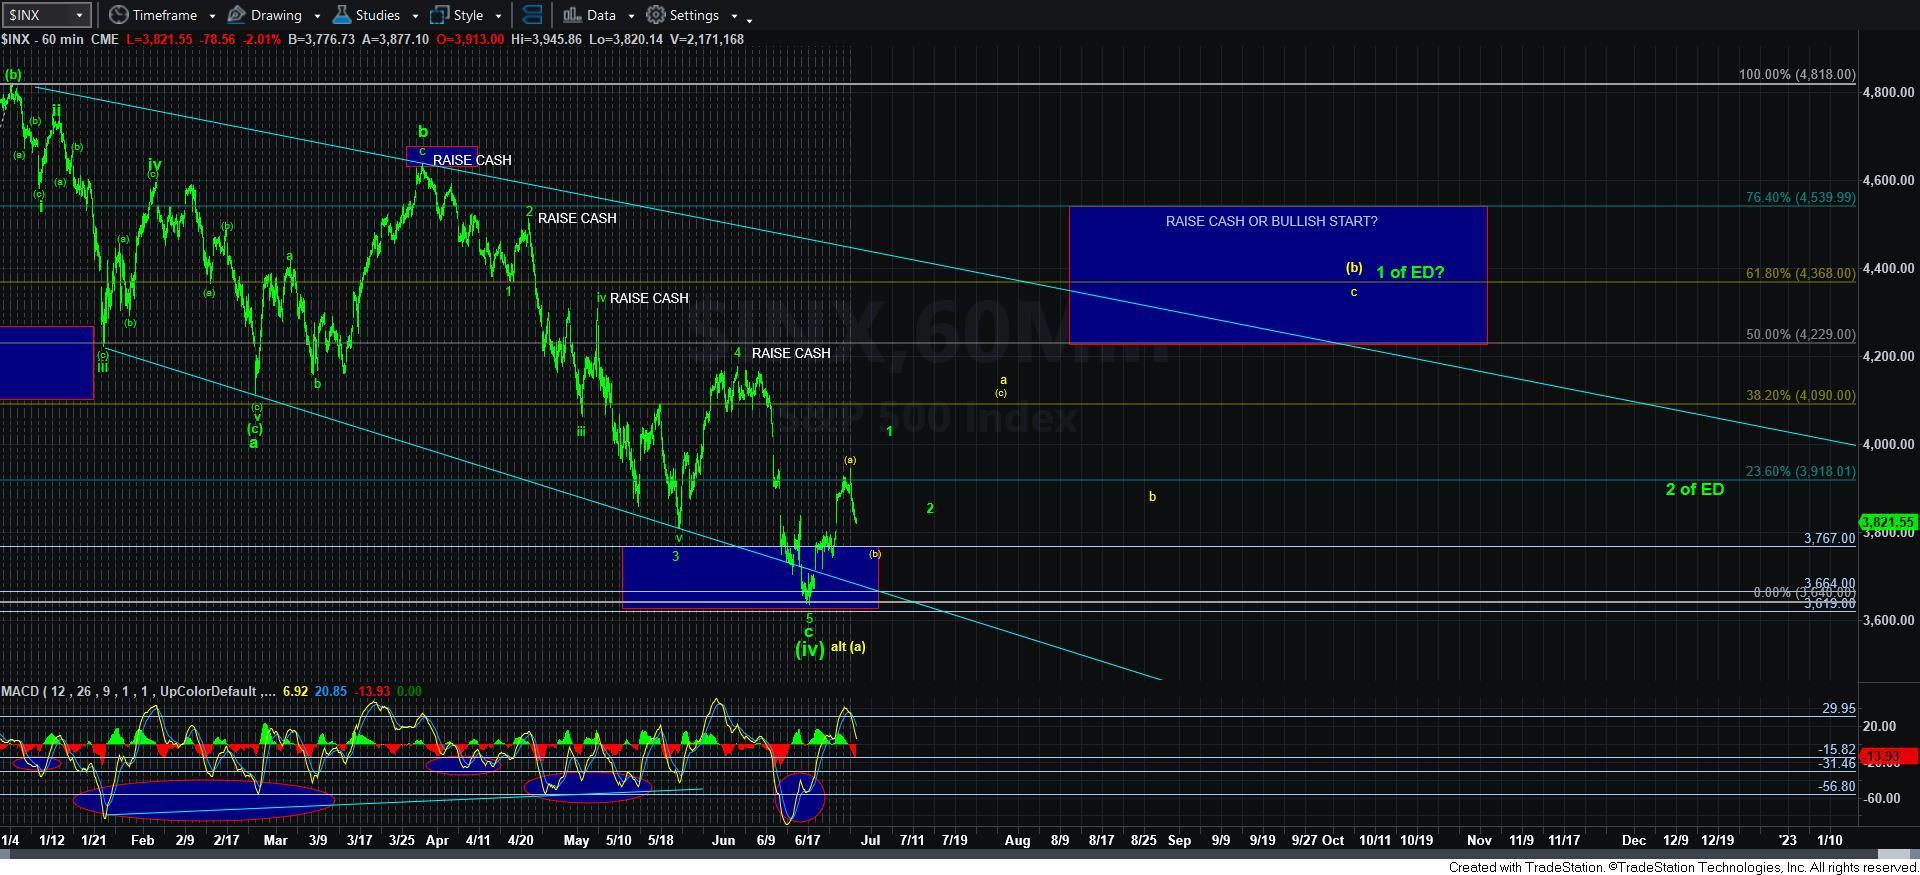
Now, please take note that this a-wave is the initial wave in a 3-wave structure in the larger [b] wave in yellow, which ideally should be taking us many weeks and pointing us north of 4200SPX. This yellow count would be pointing us much lower later this year in the [c] wave down in a much larger ending diagonal structure I spoke about in my weekend update a few weeks ago. This really is not my preference, as it does not fit really well in the larger degree structures in many individual stocks and other index structures. But, I still have a hard time adopting a major long-term top having been struck due to its 3-wave structure, which I have addressed in many prior weekend updates as well.
The other potential that I will be forced to track is that larger 3-wave rally taking us north of 4200SPX is an a-b-c structure for wave 1 of a larger ending diagonal, pointing us to 5150+. Again, I do not trust diagonals until they prove themselves, which means we will still need a larger wave 2 pullback, followed by a rally back over the high of wave 1 before I am willing to adopt this wave count.
So, as you can see, a rally back up to the 4200+ region will likely take shape as a 3-wave structure – that is, unless the market does provide the green 1-2 on the 5-minute SPX chart. But, assuming that the market takes us up to the 4200+ region in an a-b-c structure, that would be the ideal time to raise a significant amount of cash in case the yellow count does take shape. But, if the market can prove the ending diagonal structure by rallying back over the high we strike in that larger degree box over 4200SPX, then we can always get back into the market.
Again, my preference would be to move back into the market with the 50 stocks that our StockWaves analysts have identified as having more likely higher highs being struck into next year, as we want to increase our probabilities for trading for those higher highs. But unless the market provides us with the leading diagonal structure outlined on the 5-minute SPX chart in green, any multi-week rally should be used to raise cash.
Unfortunately, due to the 3-wave structures the market is giving us, it leaves many paths open as these structures are quite variable. I am providing a general path which I think highlights the higher probability expectations at this time. But, please recognize that these structures are very hard to trade (other than the 5-wave structures we expect in c-waves). Whipsaw will likely be a common theme, and you must maintain a healthy respect for this type of environment.