Trying To Complete This Structure
With the manner in which the market reacted this morning, it certainly looked like the market was going to attempt to complete the wave v of the current rally off Friday’s low. But, instead, we simply traded sideways all day.
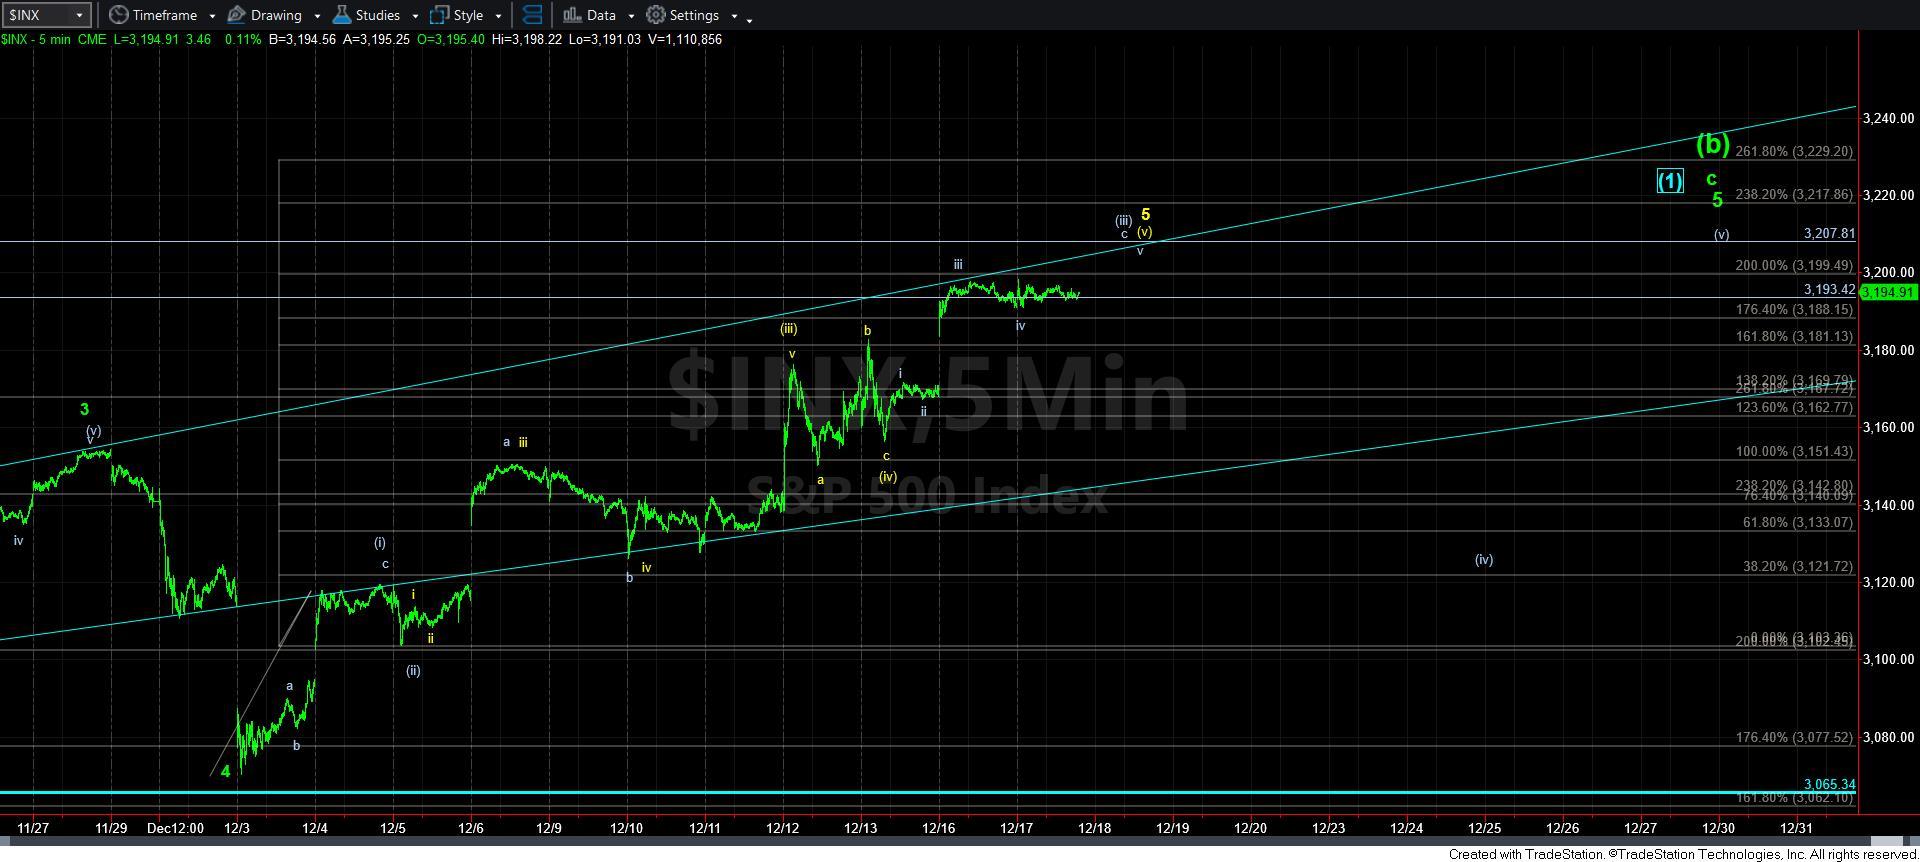
So, in the ideal scenario, I am still looking for a wave v to complete the structure off Friday’s low, as long as we do not break below 3185SPX.
But, once we do break back below 3185SPX, we can certainly have struck a top to this structure off the December 3rd low. But, other charts still seem to be incomplete and may need another 4th and 5th wave. Therefore, I have the wave [iv][v] still presented on the 5-minute SPX chart. Yet, this would likely be as an ending diagonal structure, as outlined in my discussion last night.
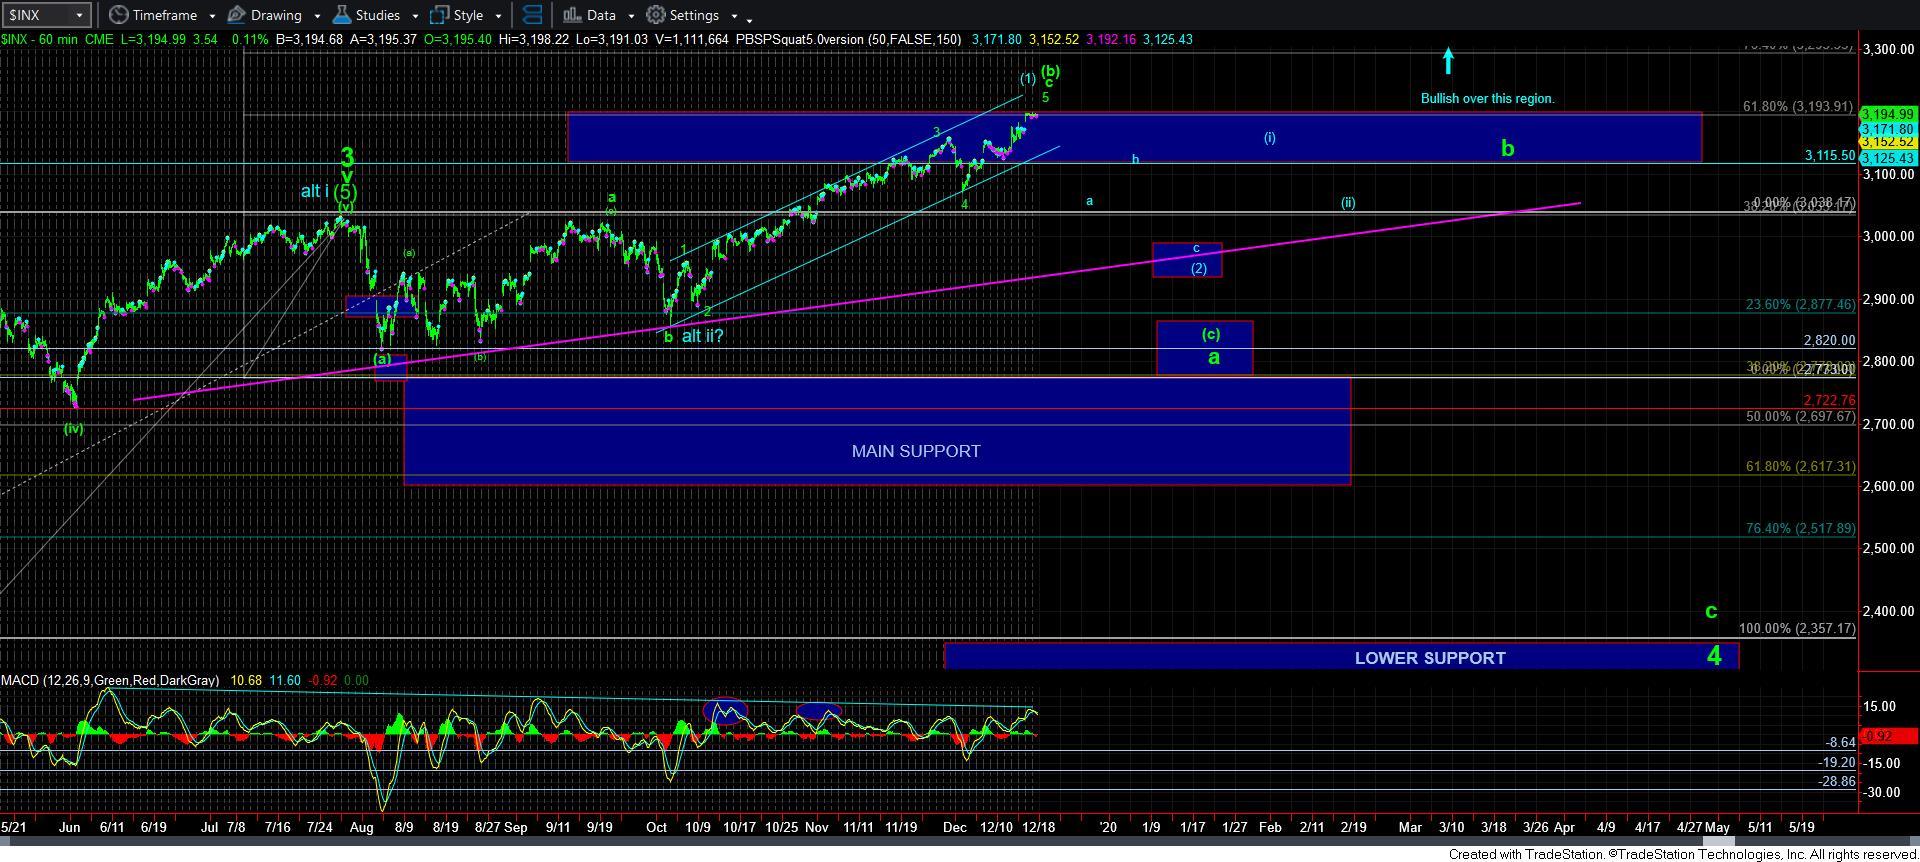
Ultimately, we would still need to break down below 3115SPX and break 3070SPX to suggest a top has been struck to the rally off the October low. Moreover, the structure of that break down below 3070SPX will likely tell us the story as to whether the blue or green count is the operable expectation.
For now, I have taken off the purple count, because I think we have come up a bit high for me to maintain it as a strong consideration. But, if the market breaks down below 3070 in a clearly corrective manner which makes the blue count my primary count, then I will bring back the purple count as an alternative at that time, since the green count will be taken off the chart at that time.
For today, 3185SPX is our micro support up here and as long as we hold it, we can see one more thrust higher for a wave v, as shown. A break down below 3185SPX is the first signal of a potential top being struck, with an expectation of testing at least the 3150 region.