Trying To Bottom - Market Analysis for Aug 29th, 2022
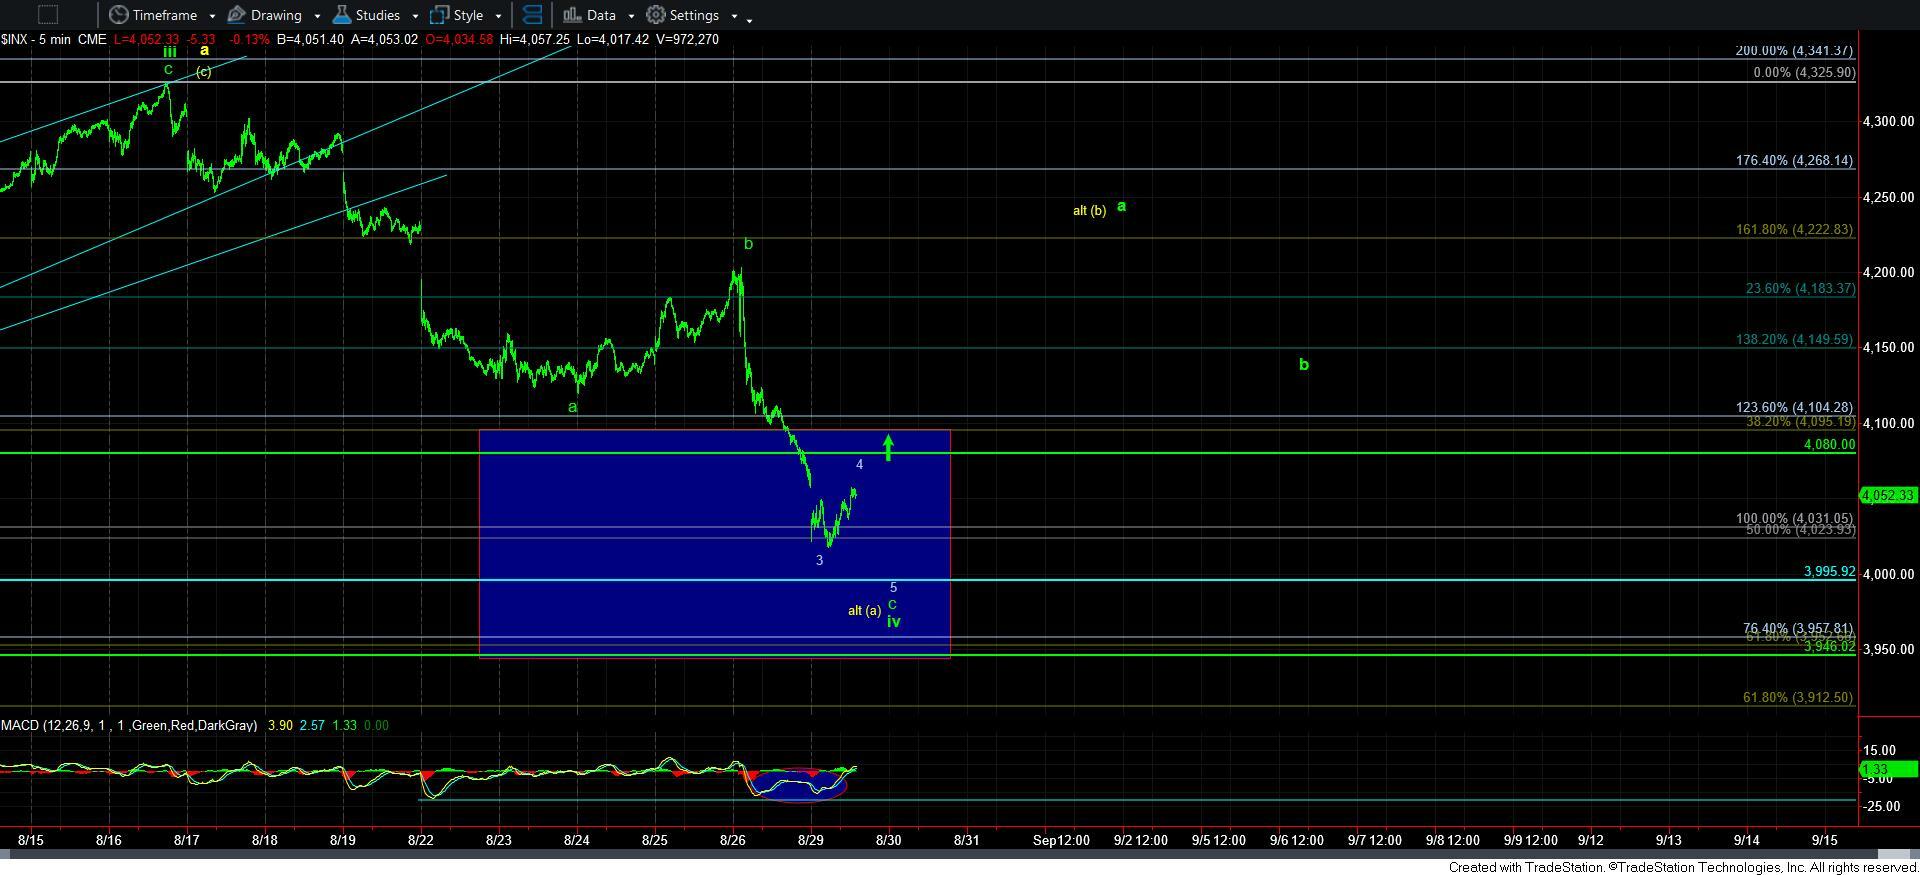
As the market has continued lower into our support box, we have been getting a nice bounce this morning. The question is what does it represent?
If you remember from my prior write-ups, I outlined that any rally off a low will likely be a corrective looking rally, taking on an a-b-c structure. And, since we do not have a well defined 4th wave in this 5-wave c-wave decline, this rally we are now seeing can be either wave 4 in the c-wave, or it may have begun the green a-wave or yellow alt [b] wave. You see, while a minority of a-waves rally in a 5-wave structure, they and [b] waves most commonly take shape as a-b-c structures.
Therefore, it leaves us referring to resistance points for guidance. I am currently viewing the 4080SPX region as our resistance, as it was prior support. As long as we remain below it, it is reasonable to view this bounce as a 4th wave in the c-wave, as shown on the 5-minute SPX chart.
But, once we move through the 4080SPX region, I think we can look up towards the 4200-4250SPX region for the a-wave/alt[b] wave rally. But, remember, we will not be able to distinguish between these two wave counts until we see how the market declines from the conclusion of that rally. A corrective decline keeps us in the green count and an impulsive count puts us in the yellow/red.
So, for now, I think we may see one more lower low to complete the c-wave of iv. But, once we move through 4080, then I am looking to continue to the 4200-4250SPX region.