Trying To Base For A Rally
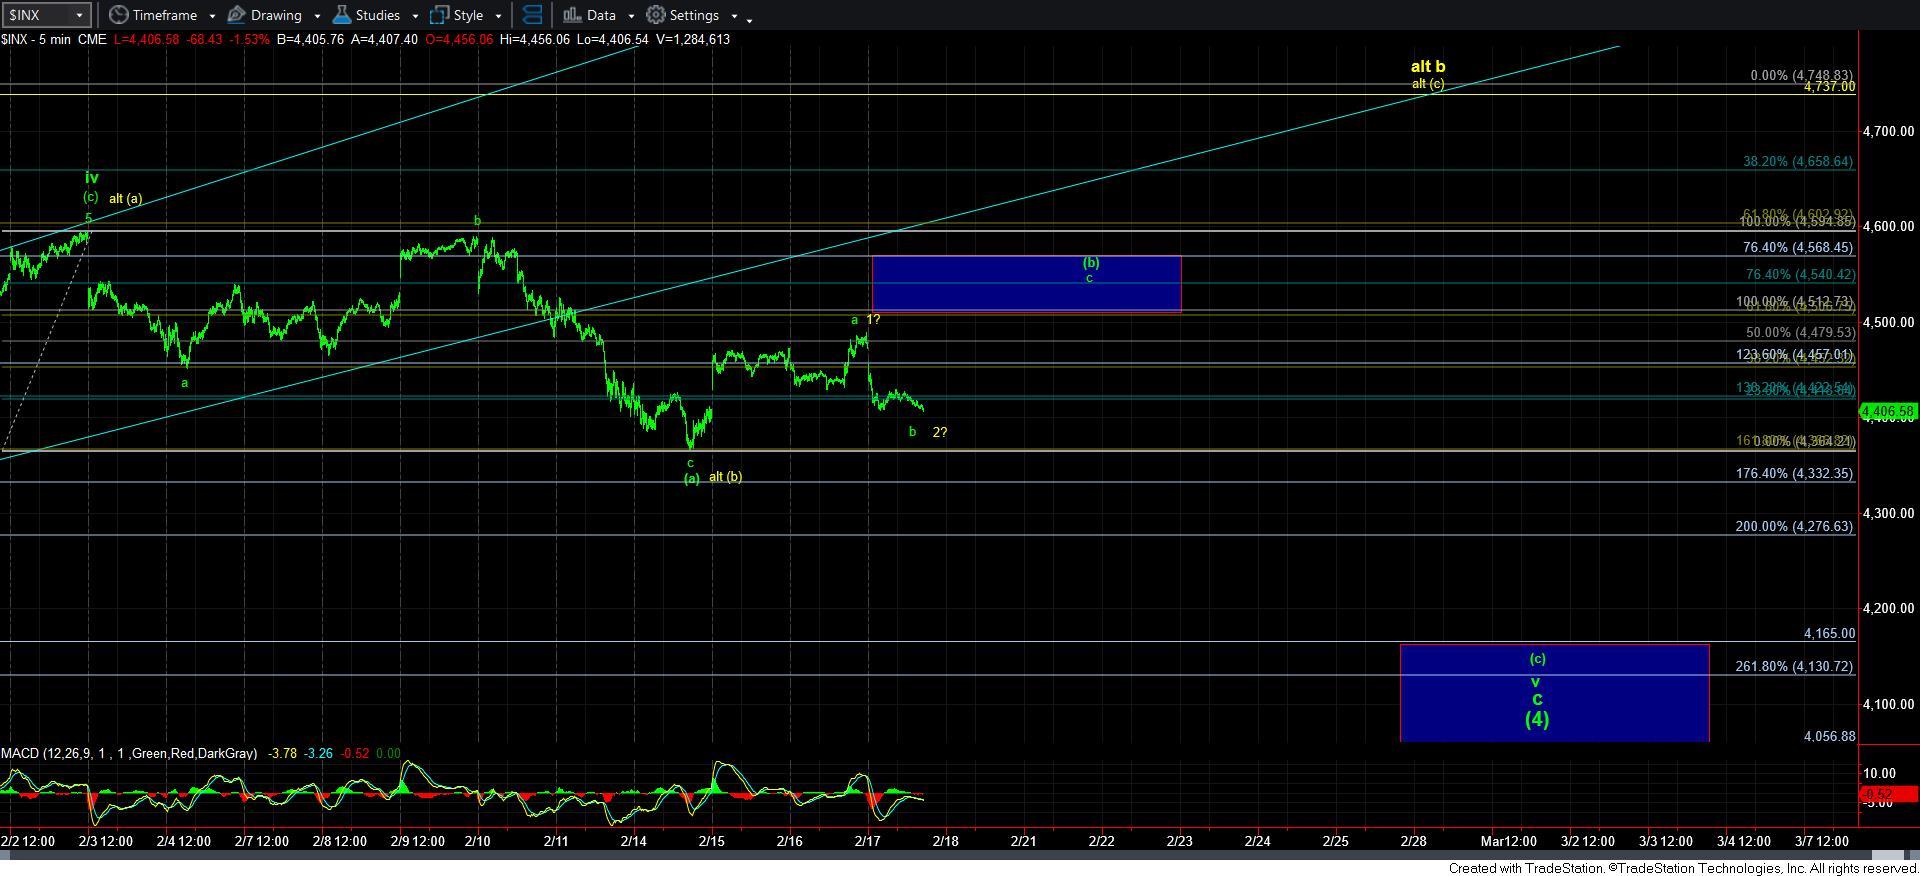
With the market choosing the lower low for the potential b-wave within a [b] wave I outlined yesterday, I am again going to reiterate that I think we can still get another rally in the coming days as long as we remain over the 4365ES level.
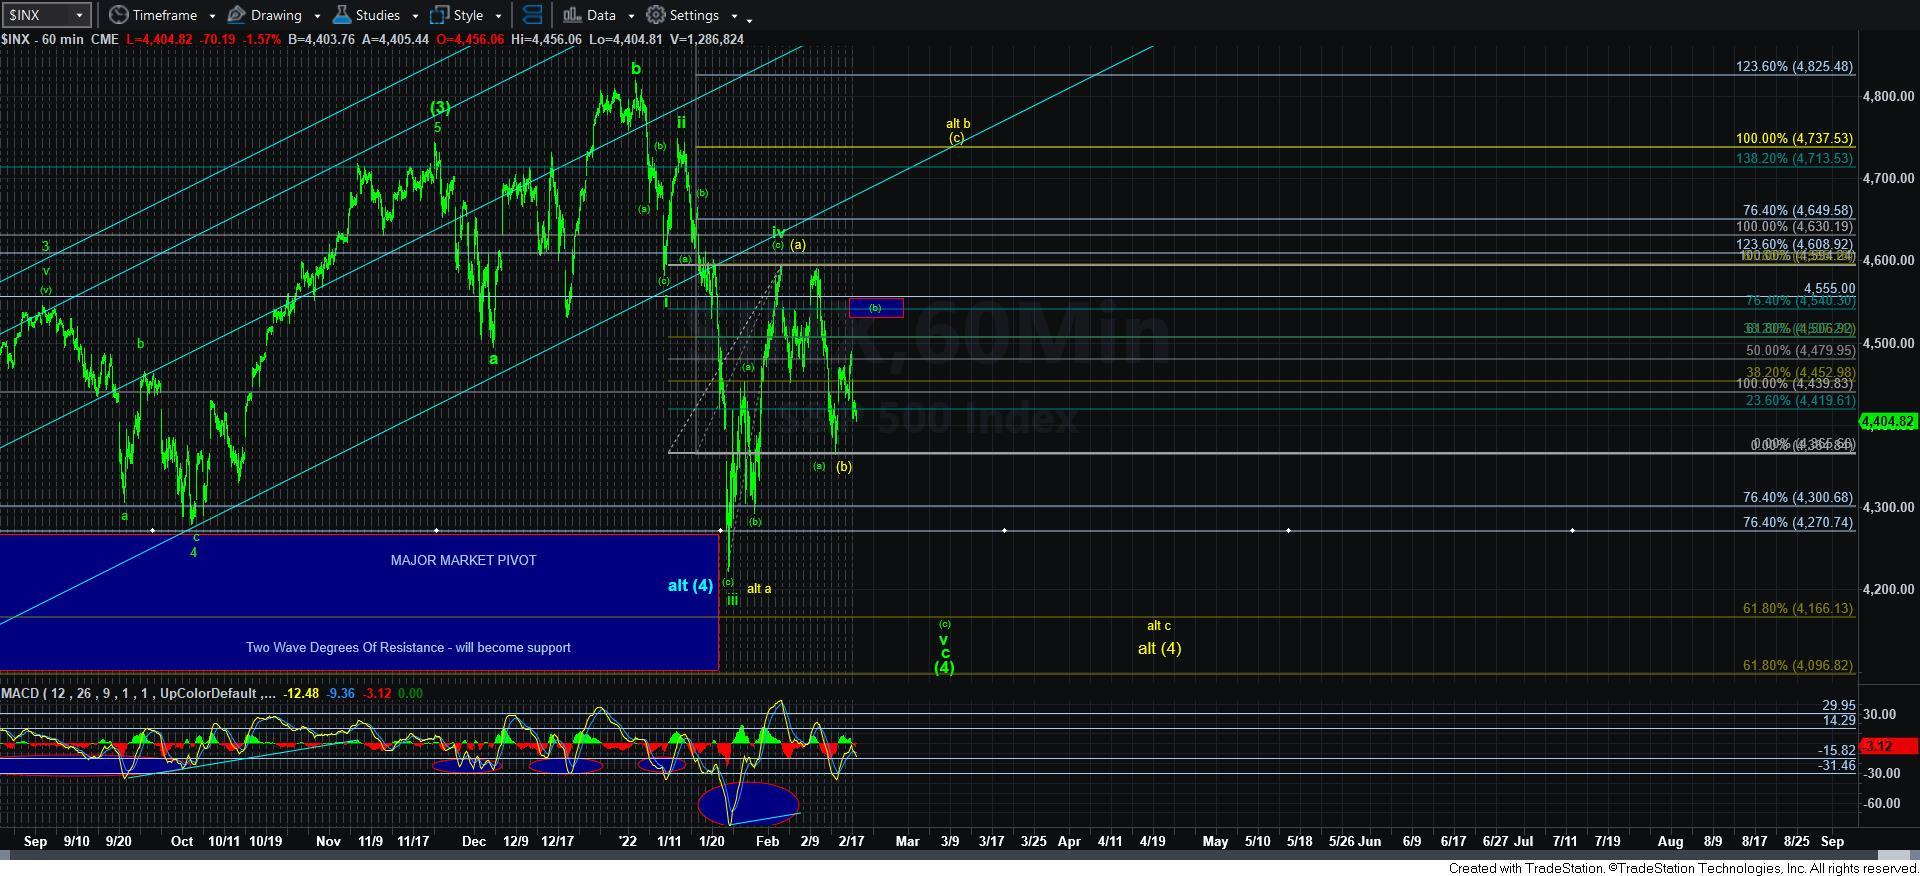
So, with the pullback today, we are tracking it as a b-wave pullback within a [b] wave rally within wave v of an ending diagonal to complete the c-wave of wave [4]. Again, if it is hard to visualize what I am saying, please review the attached 5 minute and 60 minute SPX chart.
Clearly, the alternative I am tracking is still the yellow count, but as I noted yesterday, and will reiterate again today, I am not seeing strong confluence of calculations suggesting this is what will play out. But, please keep in mind that surprises can still come to the upside, and we need to remain focused on the bigger picture. To that end, I want to re-post what I posted earlier as an alert:
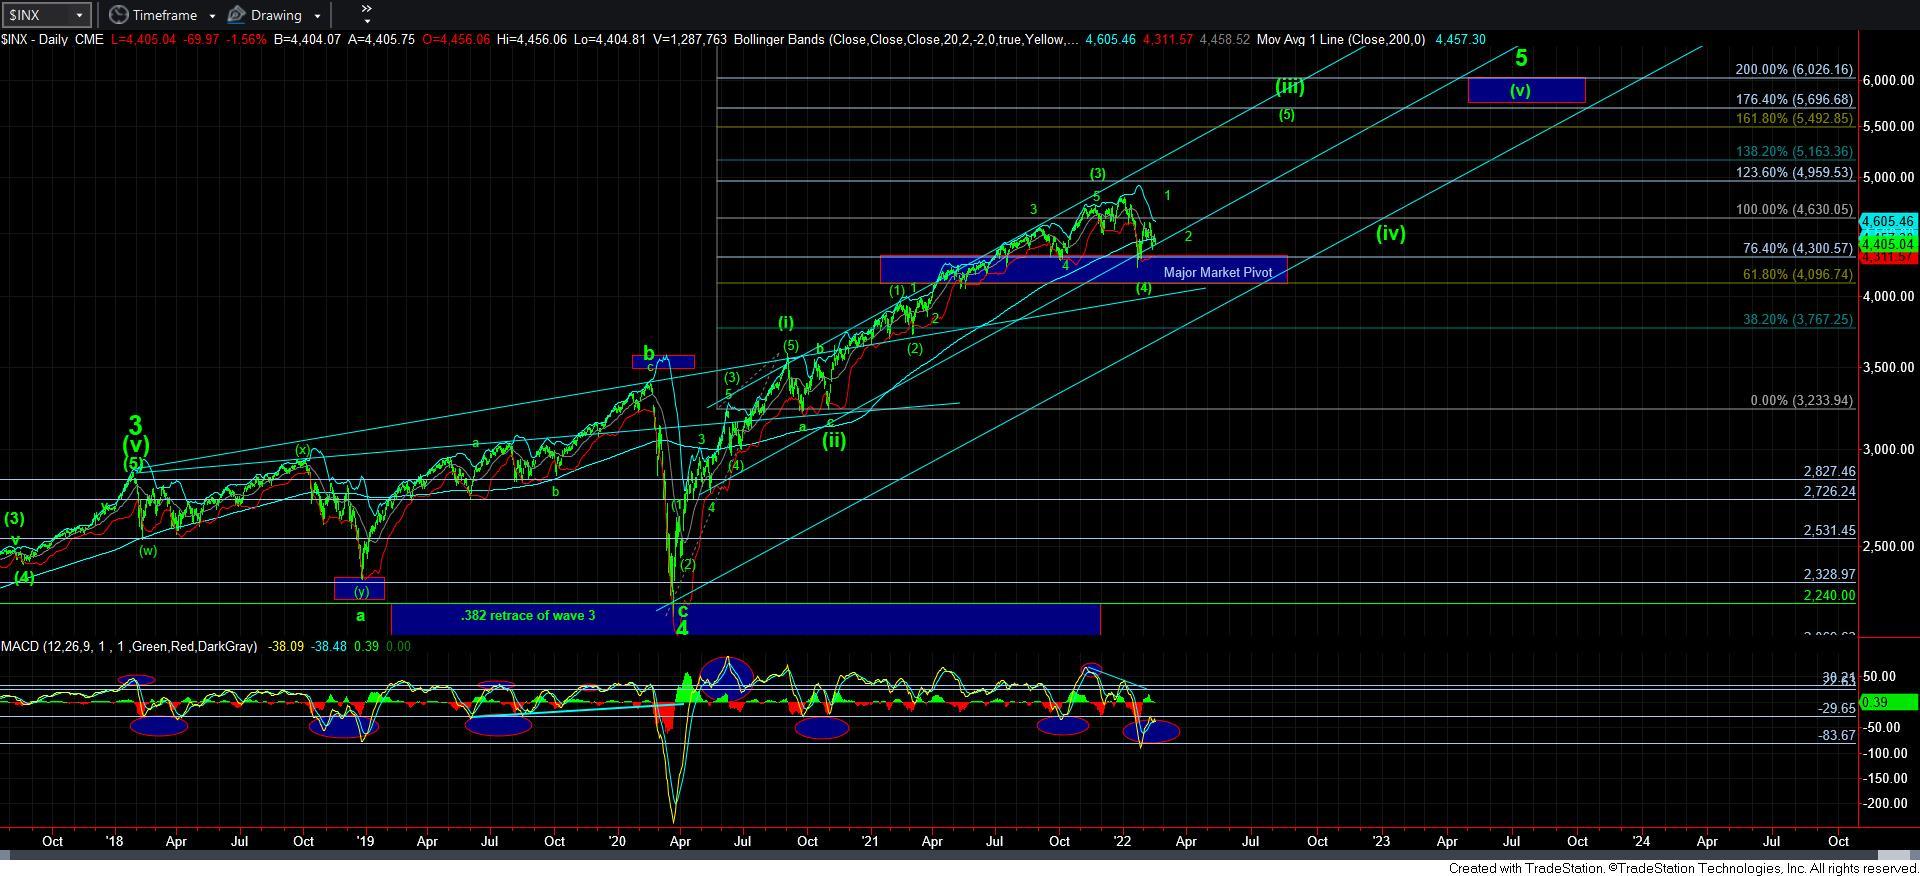
“I want to take a minute to make a point about the bigger picture in SPX. I do not think I have made a secret out of my expectation to rally to 5500 in the next major bull run I expect for 2022 into early 2023. Moreover, I did not make it a secret that I raised cash near the recent market highs and deployed some of that cash near the lows we recently struck.
Now, I know many of you may be trying to trade the market within this whipsaw, despite my warnings that this type of environment will cut up even the best of traders. Rather, I think the most prudent path for most of you is to take a step back and consider "where is the next place I want to add the remaining cash that I raised."
To that end, my primary expectation is that we can see a lower low than the one recently struck, and I have two paths pointing to that. So, clearly, that would be the next point to deploy cash.
But, there is still "some" potential that I have in the back of my mind that the lows may be in, even though I have no clear structure telling me so in the SPX. But, I do see some of that potential evidenced in the IWM and EEM.
So, for now, you may want to be focusing your cash on some of the individual stock charts that will more likely see lower lows that have been outlined by our StockWaves team. As for me, that is what I am going to be doing over the coming weeks.
My main point is that most of you should be focusing upon where you want to deploy your remaining cash for the next bullish run we expect, rather than trying to cut your fingers while trading this whipsaw environment, which does not look like it has yet completed. Keep in mind that the bigger picture is telling us that we LIKELY have 1100 points higher with approximately 300 points of downside risk. Do not lose sight of the forest while looking at the pretty leaves.”
Lastly, I want to again reiterate that the 4365ES level is the support I am watching down here. As long as we hold over it, I am looking for another rally in either the green b-wave (primary) or the yellow wave 3 (alternative). Should we break down below that support, then it opens the door to complete the [c] wave of wave v of the ending diagonal in green sooner rather than later. But, in the meantime, whipsaw potential is still rather high.